
Prometheus
Prometheus is an open-source monitoring solution that provides powerful metrics, alerting, and visualization for time series data.
 Tags
Tags
 Useful for
- 1.What is Prometheus?
- 2.Features
- 2.1.1. Dimensional Data Model
- 2.2.2. Powerful Queries with PromQL
- 2.3.3. Great Visualization Options
- 2.4.4. Efficient Storage
- 2.5.5. Simple Operation
- 2.6.6. Precise Alerting
- 2.7.7. Extensive Client Libraries
- 2.8.8. Numerous Integrations
- 2.9.9. Open Source and Community-Driven
- 3.Use Cases
- 3.1.1. Microservices Monitoring
- 3.2.2. Infrastructure Monitoring
- 3.3.3. Application Performance Monitoring (APM)
- 3.4.4. Alerting and Incident Management
- 3.5.5. Capacity Planning
- 4.Pricing
- 5.Comparison with Other Tools
- 5.1.1. Open Source vs. Proprietary Solutions
- 5.2.2. Dimensional Data Model
- 5.3.3. Native Support for Cloud-Native Environments
- 5.4.4. Query Language
- 5.5.5. Scalability and Performance
- 6.FAQ
- 6.1.Q1: What is the primary use case for Prometheus?
- 6.2.Q2: Can I integrate Prometheus with other visualization tools?
- 6.3.Q3: Is Prometheus suitable for large-scale deployments?
- 6.4.Q4: How does Prometheus handle alerting?
- 6.5.Q5: Is there a cost associated with using Prometheus?
- 6.6.Q6: What programming languages are supported by Prometheus client libraries?
- 6.7.Q7: Can Prometheus monitor third-party services?
What is Prometheus?
Prometheus is an open-source monitoring and alerting toolkit designed for reliability and scalability. It was developed by SoundCloud in 2012 and has since become a prominent solution in the Cloud Native Computing Foundation (CNCF). Prometheus is particularly well-suited for monitoring dynamic cloud environments and microservices architectures, making it a popular choice among DevOps teams and site reliability engineers (SREs). Its powerful querying language, flexible data model, and robust alerting capabilities allow users to gain deep insights into their systems and applications.
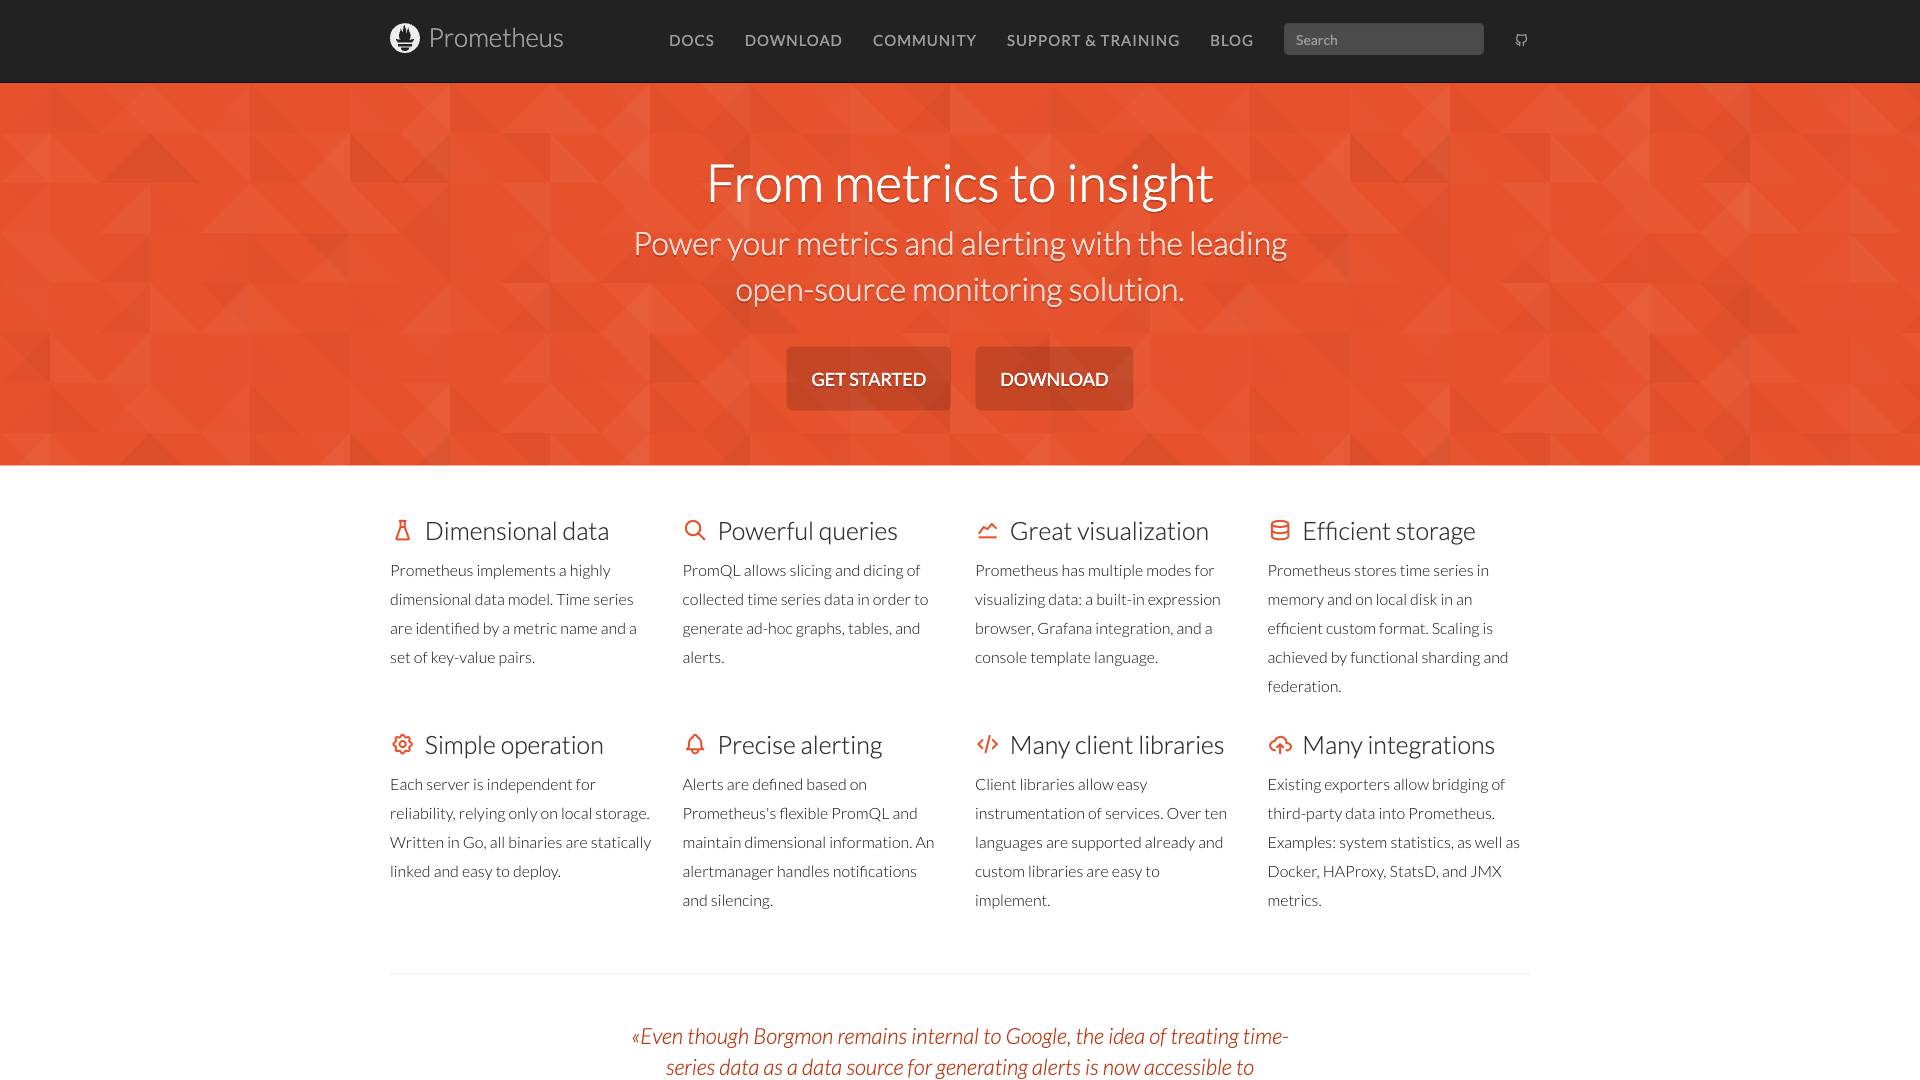
Features
Prometheus boasts a range of features that make it a leading choice for monitoring solutions:
1. Dimensional Data Model
Prometheus implements a highly dimensional data model where time series are identified by a metric name and a set of key-value pairs (labels). This allows for rich and flexible data representation, enabling users to slice and dice metrics based on various dimensions.
2. Powerful Queries with PromQL
Prometheus Query Language (PromQL) is a powerful querying language that allows users to retrieve and manipulate time series data. PromQL enables users to generate ad-hoc graphs, tables, and alerts, making it easy to analyze and visualize metrics over time.
3. Great Visualization Options
Prometheus provides multiple modes for visualizing data:
- Built-in Expression Browser: A simple interface for visualizing metrics directly within Prometheus.
- Grafana Integration: Prometheus can be seamlessly integrated with Grafana, a popular open-source visualization tool, to create more complex and visually appealing dashboards.
- Console Template Language: Users can create custom visualizations using a console template language.
4. Efficient Storage
Prometheus employs an efficient custom storage format, storing time series data in memory and on local disk. This design allows it to handle large volumes of data while maintaining high performance. Scaling is achieved through functional sharding and federation, ensuring that users can expand their monitoring capabilities as needed.
5. Simple Operation
Prometheus servers are designed to be independent, enhancing reliability. Each server relies solely on local storage, which simplifies deployment and operations. Written in Go, all binaries are statically linked, making it easy to deploy across various environments.
6. Precise Alerting
Prometheus supports flexible alerting capabilities based on its PromQL language. Users can define alerts that maintain dimensional information, ensuring that alerts are relevant and actionable. An integrated Alertmanager handles notifications, silencing, and grouping of alerts, making it easier to manage alerting workflows.
7. Extensive Client Libraries
Prometheus offers a wide range of client libraries that facilitate easy instrumentation of services. It supports over ten programming languages, including Go, Java, Python, and Ruby, allowing developers to instrument their applications with minimal effort. Custom libraries can also be implemented for additional languages.
8. Numerous Integrations
Prometheus can integrate with various third-party data sources through existing exporters. These exporters can bridge data from systems like Docker, HAProxy, StatsD, and JMX metrics, enabling users to monitor a wide range of applications and infrastructure components.
9. Open Source and Community-Driven
Prometheus is fully open source and community-driven, with all components available under the Apache 2 License on GitHub. This openness fosters collaboration and innovation, allowing users to contribute to the project and benefit from community support.
Use Cases
Prometheus is versatile and can be applied in various scenarios:
1. Microservices Monitoring
In modern cloud-native architectures, where applications consist of numerous microservices, Prometheus excels at monitoring these distributed systems. Its dimensional data model allows teams to track the performance and health of individual services and their interactions.
2. Infrastructure Monitoring
Prometheus is well-suited for monitoring infrastructure components, such as servers, containers, and cloud services. By collecting metrics on CPU usage, memory consumption, and network traffic, organizations can gain insights into the performance and reliability of their infrastructure.
3. Application Performance Monitoring (APM)
Prometheus can be used to monitor application performance by tracking key metrics such as response times, error rates, and request counts. This data helps developers identify bottlenecks and optimize application performance.
4. Alerting and Incident Management
With its robust alerting capabilities, Prometheus can be configured to notify teams of potential issues before they escalate into critical incidents. By setting up alerts based on specific thresholds or anomalies, organizations can proactively manage incidents and maintain system reliability.
5. Capacity Planning
By analyzing historical metrics, organizations can make informed decisions about capacity planning. Prometheus enables teams to forecast resource requirements, ensuring that they can scale their infrastructure as needed to meet demand.
Pricing
Prometheus is an open-source tool, which means it is free to use. There are no licensing fees or hidden costs associated with its deployment. However, organizations should consider the associated costs of infrastructure, maintenance, and support when implementing Prometheus in production environments. While Prometheus itself is free, organizations may choose to invest in additional tools, such as Grafana for visualization, or managed services that provide support and hosting for Prometheus.
Comparison with Other Tools
When evaluating Prometheus against other monitoring solutions, several unique selling points and differences emerge:
1. Open Source vs. Proprietary Solutions
Prometheus is entirely open source, allowing users to modify and customize the tool to suit their needs. In contrast, many proprietary monitoring solutions come with licensing fees and restrictions on customization.
2. Dimensional Data Model
Prometheus's dimensional data model sets it apart from traditional monitoring tools that use a flat data structure. This model enables more granular and flexible queries, allowing users to analyze metrics based on multiple dimensions.
3. Native Support for Cloud-Native Environments
Prometheus is designed with cloud-native applications in mind. Its ability to monitor dynamic environments, such as Kubernetes, makes it a preferred choice for organizations adopting microservices architectures.
4. Query Language
PromQL is a powerful and expressive querying language that allows users to perform complex queries on time series data. While other monitoring tools may offer similar capabilities, Prometheus's query language is often regarded as one of the most flexible and powerful.
5. Scalability and Performance
Prometheus's efficient storage and scaling capabilities make it suitable for handling large volumes of time series data. While some monitoring solutions may struggle with performance as data volumes grow, Prometheus is designed to scale effectively through functional sharding and federation.
FAQ
Q1: What is the primary use case for Prometheus?
Prometheus is primarily used for monitoring and alerting in cloud-native environments, particularly for microservices architectures. It excels at collecting and analyzing time series data to provide insights into system performance and reliability.
Q2: Can I integrate Prometheus with other visualization tools?
Yes, Prometheus can be integrated with various visualization tools, with Grafana being the most popular choice. This integration allows users to create visually appealing dashboards and gain deeper insights into their metrics.
Q3: Is Prometheus suitable for large-scale deployments?
Absolutely! Prometheus is designed to handle large volumes of time series data efficiently. Its scaling capabilities, such as functional sharding and federation, make it suitable for large-scale deployments.
Q4: How does Prometheus handle alerting?
Prometheus allows users to define alerts based on its powerful PromQL language. An integrated Alertmanager handles notifications, silencing, and grouping of alerts, making it easier for teams to manage alerting workflows.
Q5: Is there a cost associated with using Prometheus?
Prometheus is an open-source tool and is free to use. However, organizations should consider the costs of infrastructure, maintenance, and any additional tools or services they may choose to implement alongside Prometheus.
Q6: What programming languages are supported by Prometheus client libraries?
Prometheus supports over ten programming languages, including Go, Java, Python, Ruby, and more. This extensive support allows developers to instrument their applications easily, regardless of the language used.
Q7: Can Prometheus monitor third-party services?
Yes, Prometheus can monitor third-party services through existing exporters. These exporters allow Prometheus to collect metrics from various sources, such as Docker, HAProxy, StatsD, and JMX metrics.
In conclusion, Prometheus stands out as a powerful and flexible monitoring solution for modern applications and infrastructure. Its open-source nature, combined with its robust features and community support, makes it an ideal choice for organizations looking to gain insights into their systems and maintain high levels of reliability. Whether monitoring microservices, infrastructure, or application performance, Prometheus provides the tools needed to succeed in today's dynamic environments.
Ready to try it out?
Go to Prometheus