
Nivo
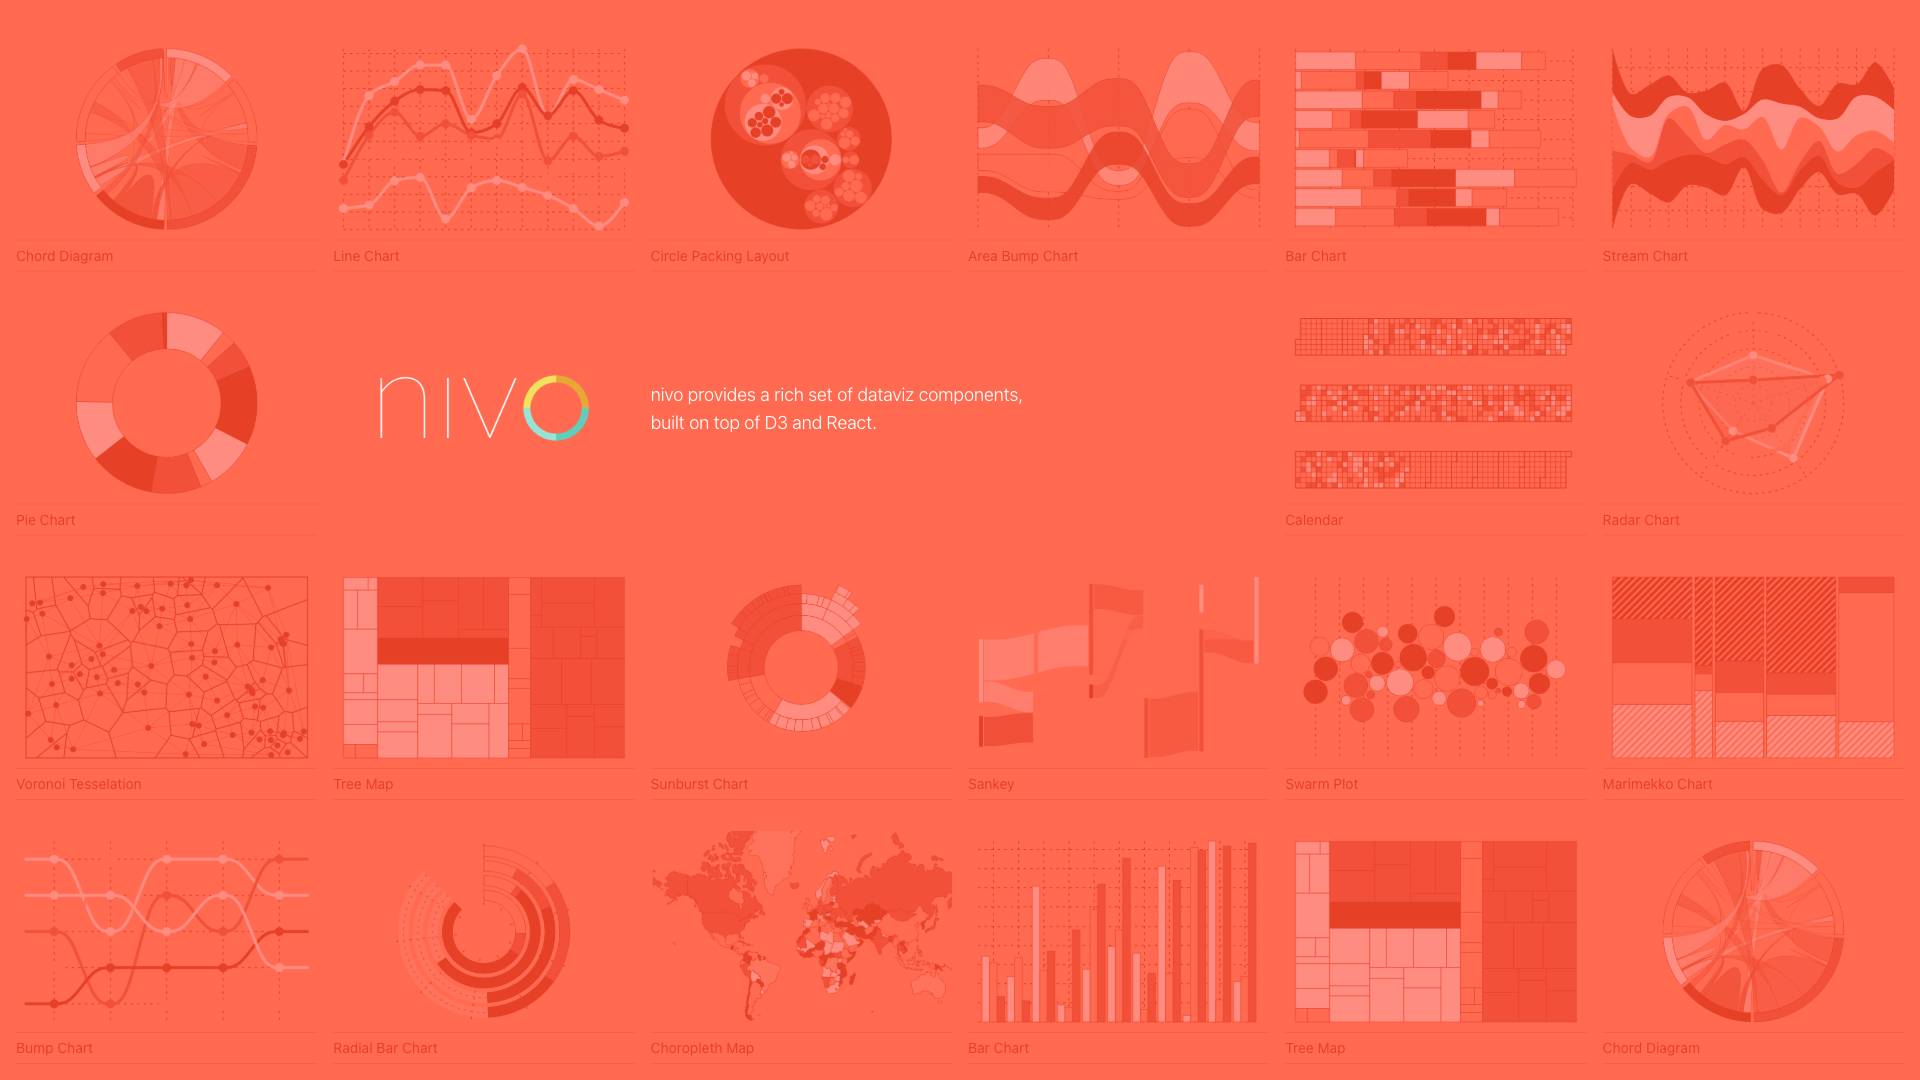
Nivo offers a comprehensive collection of customizable data visualization components built on D3 and React for enhanced data storytelling.
 Tags
Tags
 Useful for
- 1.What is Nivo?
- 2.Features
- 2.1.1. Wide Range of Chart Types
- 2.2.2. Built on D3 and React
- 2.3.3. Responsive and Customizable
- 2.4.4. Interactivity
- 2.5.5. Easy to Use
- 2.6.6. Theming Support
- 2.7.7. Data-Driven
- 2.8.8. Accessibility
- 3.Use Cases
- 3.1.1. Business Intelligence
- 3.2.2. Data Analysis
- 3.3.3. Reporting
- 3.4.4. Educational Tools
- 3.5.5. Web Applications
- 3.6.6. Marketing Analytics
- 4.Pricing
- 5.Comparison with Other Tools
- 5.1.1. Nivo vs. Chart.js
- 5.2.2. Nivo vs. D3.js
- 5.3.3. Nivo vs. Highcharts
- 6.FAQ
- 6.1.1. Is Nivo free to use?
- 6.2.2. Can I customize the appearance of Nivo charts?
- 6.3.3. Is Nivo suitable for large datasets?
- 6.4.4. Does Nivo support mobile devices?
- 6.5.5. How can I integrate Nivo into my React application?
- 6.6.6. Is there a way to handle data updates in Nivo charts?
- 6.7.7. What types of data formats does Nivo support?
What is Nivo?
Nivo is a powerful data visualization library that provides a rich set of components built on top of D3.js and React. It is designed to help developers create visually appealing and interactive data visualizations with minimal effort. Nivo offers a wide range of chart types, from basic bar and pie charts to more complex visualizations like chord diagrams and sunburst charts. The library is ideal for web applications that require dynamic and responsive data visualizations, making it a popular choice among developers and data scientists alike.
Features
Nivo comes packed with a plethora of features that cater to various data visualization needs. Some of the key features include:
1. Wide Range of Chart Types
Nivo provides an extensive collection of chart types, including but not limited to:
- Bar Chart
- Pie Chart
- Line Chart
- Area Chart
- Radar Chart
- Chord Diagram
- Sunburst Chart
- Tree Map
- Sankey Diagram
- Swarm Plot
- Marimekko Chart
- Voronoi Tesselation
- Circle Packing Layout
- Bump Chart
- Radial Bar Chart
- Choropleth Map
- Calendar Heatmap
This variety allows developers to choose the most suitable chart type for their data representation needs.
2. Built on D3 and React
Nivo leverages the power of D3.js for rendering complex visualizations and React for building user interfaces. This combination allows for seamless integration with React applications, enabling developers to create dynamic and interactive visualizations that respond to user interactions.
3. Responsive and Customizable
Nivo charts are fully responsive, meaning they automatically adjust to different screen sizes and orientations. Additionally, the library offers extensive customization options, allowing developers to modify colors, shapes, sizes, and other visual properties to match their application's design.
4. Interactivity
Nivo charts come with built-in interactivity features such as tooltips, legends, and animations. These interactive elements enhance user engagement and provide a more informative experience when interacting with the visualizations.
5. Easy to Use
Nivo is designed with developer experience in mind. The library provides a straightforward API that simplifies the process of creating and customizing charts. With clear documentation and examples, developers can quickly get up to speed with Nivo and start building visualizations in no time.
6. Theming Support
Nivo supports theming, allowing developers to define a consistent visual style across all charts in an application. This feature helps maintain a cohesive look and feel while also enabling easy adjustments to visual elements like colors and fonts.
7. Data-Driven
Nivo is designed to work with various data formats, including JSON and CSV. This flexibility makes it easy to integrate with different data sources and APIs, allowing developers to visualize data from multiple origins.
8. Accessibility
Nivo places a strong emphasis on accessibility, ensuring that charts are usable by individuals with disabilities. This includes support for screen readers and keyboard navigation, making it easier for all users to interact with the visualizations.
Use Cases
Nivo is suitable for a wide range of applications and industries. Here are some common use cases:
1. Business Intelligence
Businesses can use Nivo to create dashboards that visualize key performance indicators (KPIs), sales data, and customer analytics. The ability to create interactive charts allows stakeholders to gain insights quickly and make data-driven decisions.
2. Data Analysis
Data scientists and analysts can leverage Nivo to explore datasets visually. By using various chart types, they can identify trends, patterns, and outliers in the data, facilitating better understanding and interpretation.
3. Reporting
Nivo can be used to generate reports with visual data representations. This is particularly useful for presenting findings to stakeholders or clients, as visualizations often convey information more effectively than raw data.
4. Educational Tools
Educators can use Nivo to create interactive learning materials that help students understand complex concepts through visual representation. For example, visualizing mathematical functions or scientific data can enhance comprehension.
5. Web Applications
Developers can integrate Nivo into web applications to provide users with interactive visualizations of data. This is particularly useful for applications that involve data analysis, monitoring, or reporting.
6. Marketing Analytics
Marketers can utilize Nivo to visualize campaign performance, customer engagement metrics, and market trends. By presenting data visually, they can communicate insights effectively to their teams and stakeholders.
Pricing
Nivo is an open-source library, which means it is free to use under the MIT License. This makes it an attractive option for developers and organizations looking to implement data visualizations without incurring licensing costs. However, while the library itself is free, developers should consider costs associated with hosting, deployment, and any additional tools or services they may need to integrate with Nivo.
Comparison with Other Tools
When comparing Nivo with other data visualization libraries, several factors come into play, including ease of use, chart variety, interactivity, and performance. Here’s how Nivo stacks up against some popular alternatives:
1. Nivo vs. Chart.js
- Chart Variety: Nivo offers a broader range of chart types compared to Chart.js, which focuses primarily on basic chart types.
- Customization: Nivo provides more extensive customization options, allowing for greater flexibility in design.
- Interactivity: Both libraries offer interactive features, but Nivo’s integration with D3 allows for more complex interactions.
2. Nivo vs. D3.js
- Ease of Use: Nivo is built on top of D3.js, making it easier to use for developers who may not be familiar with D3’s complexity. D3 offers more granular control but has a steeper learning curve.
- Chart Types: Nivo provides pre-built components that save time, while D3 requires developers to build visualizations from scratch.
- Performance: D3 is highly optimized for performance, especially with large datasets, but Nivo also performs well for most use cases.
3. Nivo vs. Highcharts
- Cost: Nivo is open-source and free, whereas Highcharts requires a commercial license for non-personal use.
- Features: Highcharts offers a wide range of features and support, but Nivo’s integration with React and D3 provides unique advantages in building interactive applications.
- Community Support: Nivo has a growing community, while Highcharts has established support and resources due to its longer presence in the market.
FAQ
1. Is Nivo free to use?
Yes, Nivo is an open-source library available under the MIT License, making it free to use for both personal and commercial projects.
2. Can I customize the appearance of Nivo charts?
Absolutely! Nivo provides extensive customization options, allowing you to modify colors, shapes, sizes, and other visual properties to fit your design requirements.
3. Is Nivo suitable for large datasets?
Nivo performs well with most datasets, but for extremely large datasets, performance may vary. It is always advisable to test performance based on specific use cases.
4. Does Nivo support mobile devices?
Yes, Nivo charts are fully responsive and designed to work on various screen sizes, including mobile devices.
5. How can I integrate Nivo into my React application?
Nivo provides a straightforward API that allows you to easily integrate its components into your React application. The documentation includes examples to help you get started quickly.
6. Is there a way to handle data updates in Nivo charts?
Yes, Nivo charts can react to data updates seamlessly, allowing you to create dynamic visualizations that update in real-time as data changes.
7. What types of data formats does Nivo support?
Nivo can handle various data formats, including JSON and CSV, making it easy to integrate with different data sources and APIs.
In summary, Nivo is a versatile and powerful data visualization library that combines the strengths of D3.js and React. It offers a rich set of features, a wide range of chart types, and extensive customization options, making it an excellent choice for developers looking to create interactive and visually appealing data visualizations. Whether you're building a business intelligence dashboard, an educational tool, or a web application, Nivo provides the tools you need to bring your data to life.
Ready to try it out?
Go to Nivo