
Infogram
Infogram empowers users to create interactive data visualizations effortlessly, transforming complex data into engaging charts, maps, and infographics.


 Tags
Tags
 Useful for
- 1.What is Infogram?
- 2.Features
- 2.1.Interactive Content Creation
- 2.2.Data Management
- 2.3.AI-Powered Features
- 2.4.Design Tools
- 2.5.Collaboration and Workflow
- 3.Use Cases
- 3.1.Business and Marketing
- 3.2.Education
- 3.3.Nonprofits and Government
- 3.4.Media and Journalism
- 4.Pricing
- 4.1.Free Plan
- 4.2.Paid Plans
- 5.Comparison with Other Tools
- 5.1.Infogram vs. Canva
- 5.2.Infogram vs. Tableau
- 5.3.Infogram vs. Google Data Studio
- 6.FAQ
- 6.1.What types of visualizations can I create with Infogram?
- 6.2.Is Infogram suitable for beginners?
- 6.3.Can I collaborate with my team on Infogram projects?
- 6.4.Does Infogram support live data updates?
- 6.5.Is there a free version of Infogram?
- 6.6.Can I import my existing projects into Infogram?
- 6.7.How does Infogram ensure brand consistency?
What is Infogram?
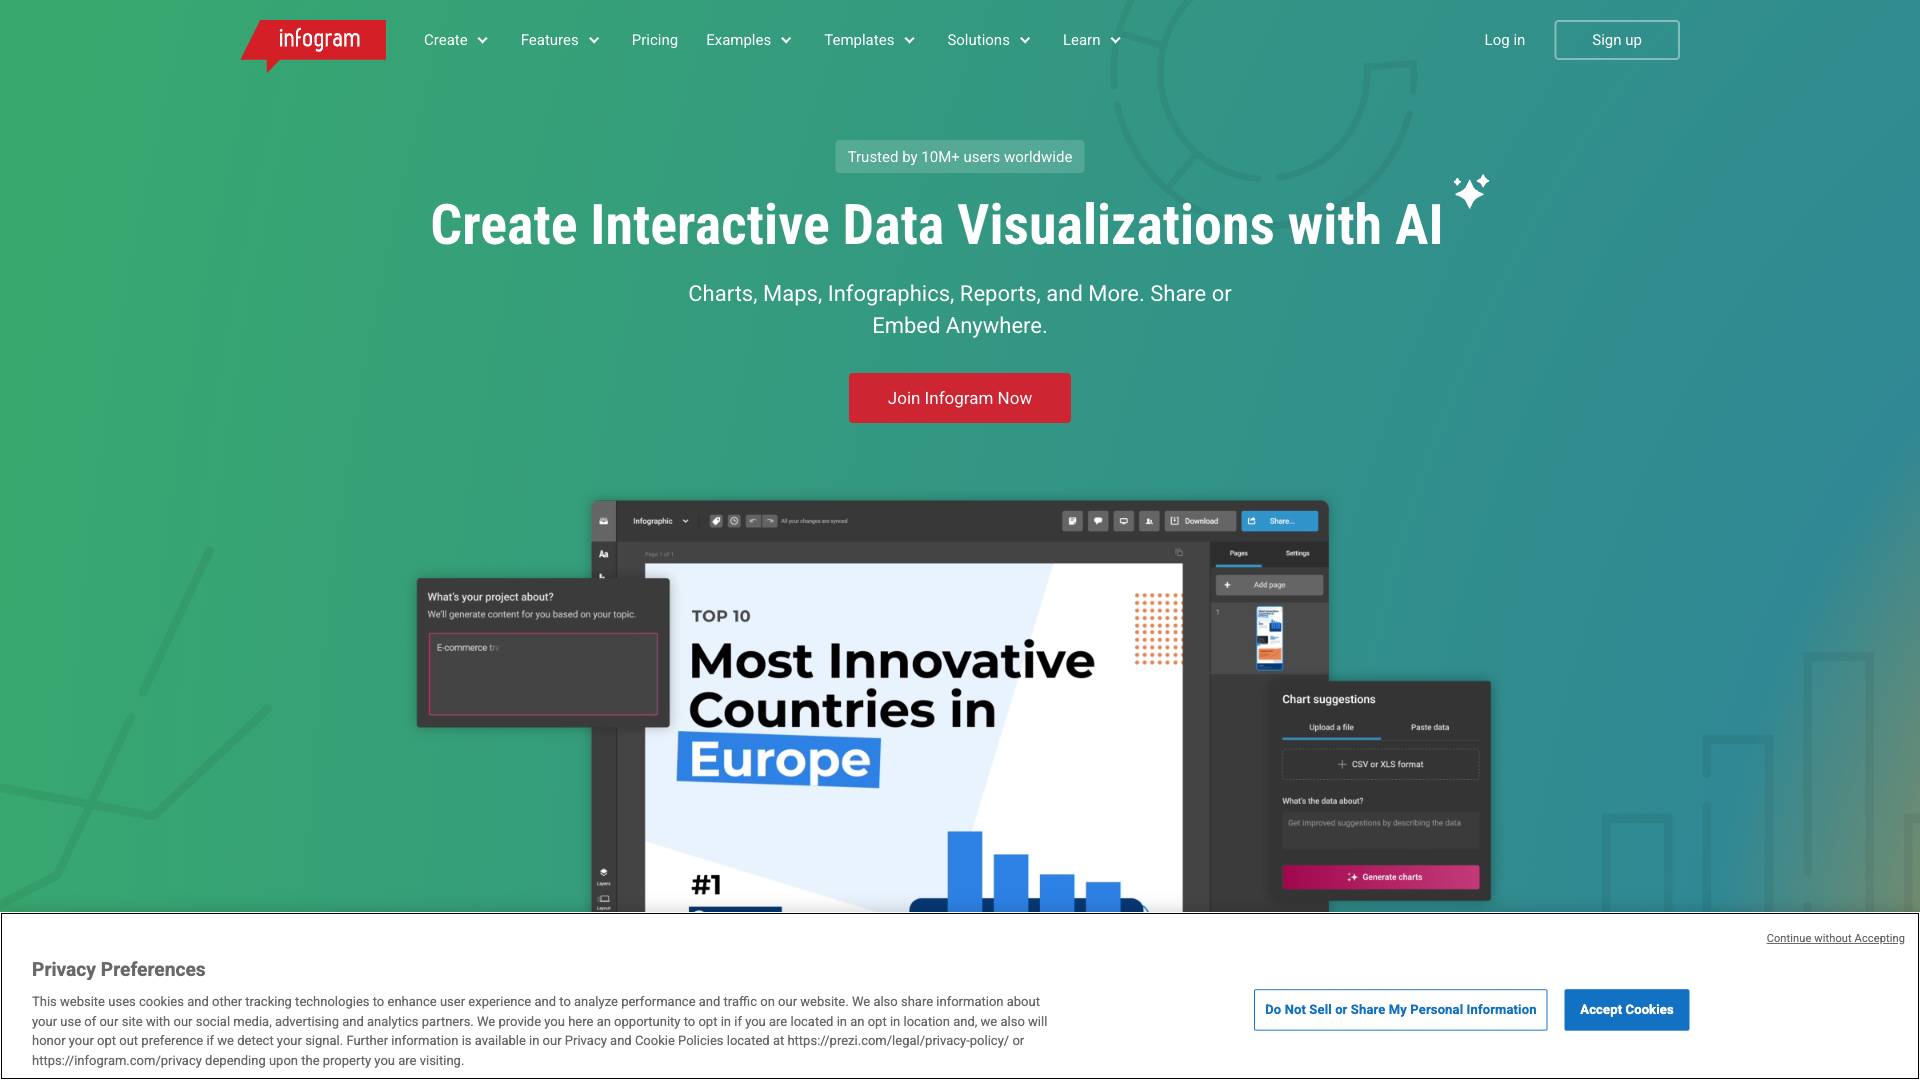
Infogram is an innovative online tool designed for creating interactive data visualizations, including charts, maps, infographics, reports, and more. With its user-friendly interface and powerful features powered by artificial intelligence (AI), Infogram allows users to transform complex data into visually appealing and easy-to-understand graphics. Trusted by over 10 million users worldwide, Infogram caters to a wide range of audiences, from global enterprises to students and individuals looking to enhance their presentations and reports.
Features
Infogram boasts a rich array of features designed to facilitate the creation of stunning visual content. Below is a comprehensive overview of its key features:
Interactive Content Creation
- Customizable Charts and Maps: Users can choose from over 35 different chart types and 800+ map styles. This extensive library allows for the selection of the most suitable visualization for any dataset.
- Dynamic Interactivity: Infogram’s interactive designs include customizable tooltips, dynamic legends, and animated charts, which help engage audiences effectively.
Data Management
- Live Data Updates: Infogram supports auto-updating data, ensuring that visualizations reflect real-time information for accurate insights.
- Data Import Options: Users can connect to various data sources, including MySQL and PostgreSQL, or easily upload files from their devices.
AI-Powered Features
- AI Infographic Generation: By simply entering a topic or data, users can leverage AI to generate visually stunning infographics in seconds, eliminating design stress.
- AI Charts and Graphs Generation: Infogram’s AI technology can transform raw data into clear, professional charts or graphs without requiring design expertise.
- AI Chart Recommendations: Users can upload their data, and Infogram will recommend the most effective chart types, saving time and enhancing clarity.
Design Tools
- Royalty-Free Asset Library: Infogram provides access to a diverse range of premium visual assets, including photos, videos, stickers, and GIFs, allowing users to enrich their projects.
- Image Background Remover: This feature enables users to remove backgrounds from images effortlessly, focusing on specific elements.
- One-Click Resizing: Users can resize their project layout instantly with a single click, making adjustments quick and easy.
- Visual Effects: Infogram allows users to apply subtle effects like zoom, bounce, flip, or fade to enhance the professional appearance of their visuals.
- Color Customization: Features like color picking, image tinting, and gradient application enable users to match colors and create visually cohesive designs.
Collaboration and Workflow
- Real-Time Collaboration: Teams can work seamlessly on projects, share feedback, and manage workflows efficiently, fostering collaboration and enhancing productivity.
- Brand Kit: Infogram helps maintain brand consistency by allowing users to create a centralized hub for logos, colors, and fonts, ensuring that every project aligns with the brand identity.
- Content Engagement Analytics: Users can track viewer behavior, demographics, and sharing activity, providing insights that help optimize content strategies.
Use Cases
Infogram is versatile and can be used across various sectors and for numerous purposes. Here are some common use cases:
Business and Marketing
- Reports and Dashboards: Businesses can create interactive reports and dashboards to visualize key performance indicators (KPIs) and metrics, making data-driven decisions easier.
- Marketing Campaigns: Marketers can develop infographics and interactive content to promote products or services, enhancing audience engagement and sharing potential.
Education
- Teaching Tools: Educators can use Infogram to create interactive presentations, making complex subjects more accessible and engaging for students.
- Student Projects: Students can utilize Infogram to present research findings and data analyses in a visually appealing format, improving their overall presentations.
Nonprofits and Government
- Data Visualization for Advocacy: Nonprofits can create compelling visual stories that highlight social issues and advocate for change, effectively communicating their mission to stakeholders.
- Public Reports: Government agencies can use Infogram to present data to the public in an understandable way, promoting transparency and community engagement.
Media and Journalism
- Interactive Articles: Journalists can enhance their stories with interactive charts and infographics, providing readers with a more immersive experience.
- Data Journalism: Infogram can be used to visualize complex data sets, making it easier for readers to comprehend the information being presented.
Pricing
Infogram offers a range of pricing plans to cater to different user needs, including a free version and several paid tiers. Here is a breakdown of the pricing structure:
Free Plan
- Basic features with limited access to templates and assets.
- Ideal for individuals or small projects.
Paid Plans
- Pro Plan: Includes advanced features such as additional templates, premium assets, and the ability to collaborate with teams. Suitable for small to medium-sized businesses.
- Team Plan: Designed for larger teams, offering enhanced collaboration features, brand kits, and advanced analytics.
- Enterprise Plan: Custom solutions for large organizations with specific needs, including dedicated support and advanced integrations.
Each paid plan typically includes a free trial period, allowing users to explore the features before committing to a subscription.
Comparison with Other Tools
Infogram stands out in the crowded market of data visualization tools due to its unique combination of features and user-friendly interface. Here’s how it compares with some popular alternatives:
Infogram vs. Canva
- Focus on Data Visualization: While Canva is a versatile design tool, Infogram specializes in data visualization, offering a broader range of interactive charts and maps.
- AI Features: Infogram’s AI-driven infographic and chart generation capabilities provide a significant advantage for users looking to save time and enhance clarity.
Infogram vs. Tableau
- Ease of Use: Infogram is more user-friendly, making it accessible to non-designers, while Tableau is a more advanced tool that may require a steeper learning curve.
- Cost: Infogram typically offers more affordable pricing options compared to Tableau, making it a better choice for small businesses and individual users.
Infogram vs. Google Data Studio
- Interactivity: Infogram excels in creating interactive infographics and visual content, while Google Data Studio is primarily focused on reporting and dashboard creation.
- Design Flexibility: Infogram provides more design customization options, allowing users to create visually appealing content that aligns with their branding.
FAQ
What types of visualizations can I create with Infogram?
Infogram allows users to create a wide range of visualizations, including charts, maps, infographics, reports, dashboards, and more.
Is Infogram suitable for beginners?
Yes, Infogram is designed to be user-friendly, making it accessible for individuals with no design experience. The AI features further simplify the process of creating professional visuals.
Can I collaborate with my team on Infogram projects?
Absolutely! Infogram offers real-time collaboration features, allowing team members to work together on projects, share feedback, and manage workflows efficiently.
Does Infogram support live data updates?
Yes, Infogram supports auto-updating data, ensuring that your visualizations reflect real-time information for accurate insights.
Is there a free version of Infogram?
Yes, Infogram offers a free plan with basic features, suitable for individuals or small projects. Paid plans with additional features are also available.
Can I import my existing projects into Infogram?
Yes, Infogram allows users to import existing projects from PDFs, PowerPoint, or Word files, enabling easy editing and enhancement of previous work.
How does Infogram ensure brand consistency?
Infogram provides a brand kit feature that allows users to create a centralized hub for logos, colors, and fonts, ensuring that all visual content aligns with the brand identity.
In conclusion, Infogram is a powerful tool for creating interactive data visualizations, offering a comprehensive suite of features that cater to a diverse range of users. Its ease of use, AI-driven capabilities, and extensive customization options make it an excellent choice for anyone looking to enhance their visual storytelling. Whether for business, education, or advocacy, Infogram provides the tools needed to transform data into compelling visuals that engage and inform audiences.
Ready to try it out?
Go to Infogram