
Highcharts
Highcharts allows users to easily create customizable charts from data, with support for various languages and a beta GPT-powered editor.
 Tags
Tags
 Useful for
- 1.What is Highcharts?
- 2.Features
- 2.1.1. Wide Range of Chart Types
- 2.2.2. Easy Data Integration
- 2.3.3. Customization Options
- 2.4.4. Interactivity
- 2.5.5. Multi-language Support
- 2.6.6. Dynamic Data Loading
- 2.7.7. Accessibility Features
- 2.8.8. Highcharts Editor and Dashboards Tool
- 2.9.9. API Access
- 2.10.10. Documentation and Support
- 3.Use Cases
- 3.1.1. Business Dashboards
- 3.2.2. Financial Reporting
- 3.3.3. Data Analysis
- 3.4.4. Web Applications
- 3.5.5. Educational Purposes
- 3.6.6. Marketing Analytics
- 3.7.7. Health Data Visualization
- 4.Pricing
- 5.Comparison with Other Tools
- 5.1.1. User-Friendly Interface
- 5.2.2. Extensive Chart Types
- 5.3.3. Interactivity and Customization
- 5.4.4. Active Community and Support
- 5.5.5. API Integration
- 5.6.6. Accessibility Features
- 6.FAQ
- 6.1.Q1: Is Highcharts free to use?
- 6.2.Q2: Can I create charts in different languages?
- 6.3.Q3: Does Highcharts provide API access?
- 6.4.Q4: What types of charts can I create with Highcharts?
- 6.5.Q5: Are there any accessibility features in Highcharts?
- 6.6.Q6: How can I get support for Highcharts?
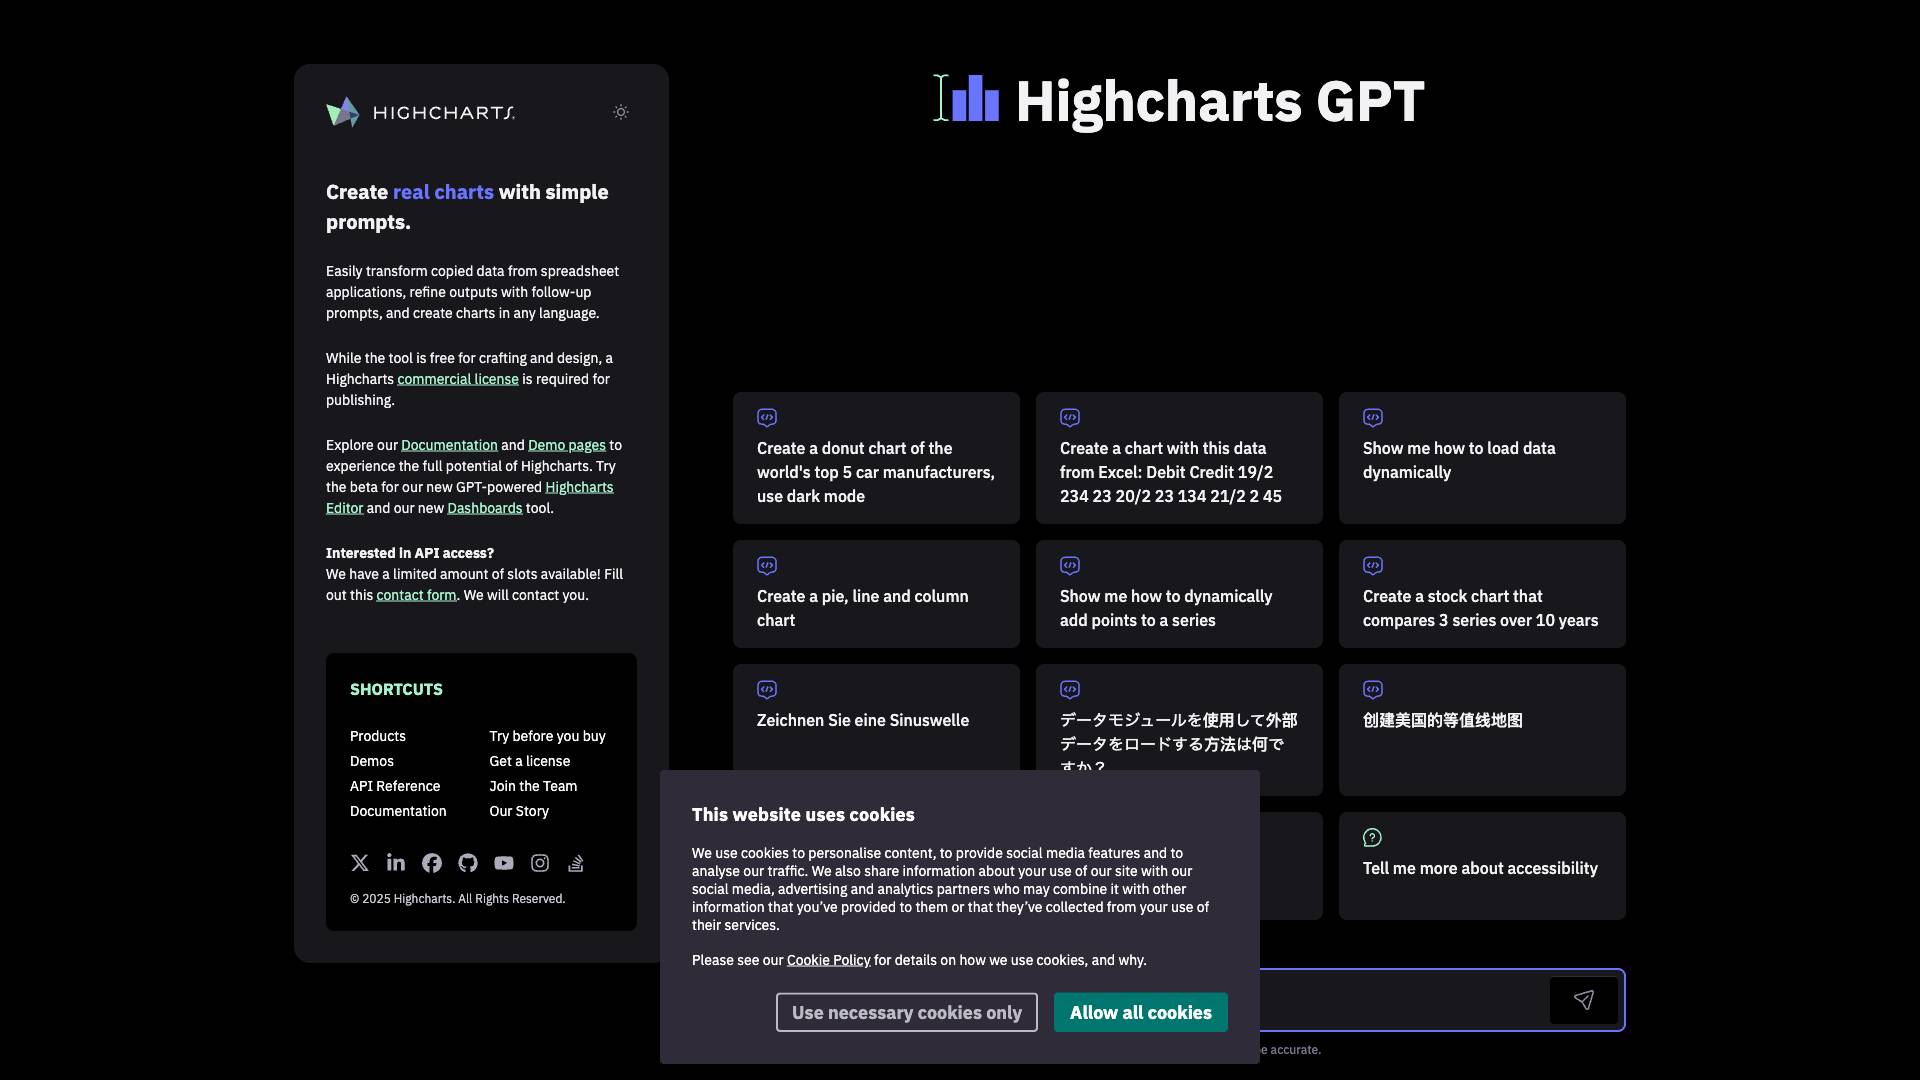
What is Highcharts?
Highcharts is a powerful charting library designed to facilitate the creation of interactive and visually appealing charts for web applications. It allows developers and non-developers alike to easily generate a wide range of chart types, from simple line and bar charts to complex stock charts and heatmaps. With its user-friendly interface and robust features, Highcharts is suitable for various applications, including business dashboards, data visualization, and reporting tools.
The tool stands out for its ability to transform raw data into meaningful visualizations quickly and effectively. It supports multiple languages and offers a range of customization options, making it a versatile choice for anyone looking to present data in an engaging manner. Highcharts also provides a commercial licensing model, ensuring that users can publish their charts without legal concerns.
Features
Highcharts comes packed with a variety of features that enhance its usability and flexibility. Some of the key features include:
1. Wide Range of Chart Types
Highcharts supports an extensive array of chart types, including:
- Line charts
- Bar charts
- Pie charts
- Column charts
- Area charts
- Scatter plots
- Heatmaps
- Stock charts
- Donut charts
- And many more!
2. Easy Data Integration
Users can easily import data from various sources, including spreadsheet applications like Excel. Highcharts allows for quick data transformation, enabling users to refine their outputs with follow-up prompts.
3. Customization Options
Highcharts provides a high degree of customization, allowing users to modify chart elements such as colors, labels, and tooltips. This flexibility ensures that charts can be tailored to fit specific branding or presentation needs.
4. Interactivity
Highcharts charts are interactive by default, allowing users to hover over data points to see detailed information. Users can also zoom in on specific areas of the chart, making it easier to analyze data trends.
5. Multi-language Support
Highcharts supports multiple languages, making it accessible to a global audience. Users can create charts in their preferred language, enhancing usability and reach.
6. Dynamic Data Loading
The tool allows for dynamic data loading, enabling users to update charts in real-time as new data becomes available. This feature is particularly useful for applications that require live data visualization.
7. Accessibility Features
Highcharts is designed with accessibility in mind, ensuring that charts are usable by individuals with disabilities. The tool includes features such as keyboard navigation and screen reader support.
8. Highcharts Editor and Dashboards Tool
Highcharts offers a beta version of its new GPT-powered Highcharts Editor, which simplifies the chart creation process. Additionally, the Dashboards tool allows users to create comprehensive dashboards that combine multiple charts for a holistic view of data.
9. API Access
For developers looking to integrate Highcharts into their applications, the tool offers API access. This allows for deeper customization and functionality, enabling developers to create unique charting solutions.
10. Documentation and Support
Highcharts provides extensive documentation and demo pages, allowing users to explore its full potential. The support team is also available to assist users with any questions or issues they may encounter.
Use Cases
Highcharts can be utilized in various scenarios across different industries and applications. Some common use cases include:
1. Business Dashboards
Organizations can use Highcharts to create interactive dashboards that display key performance indicators (KPIs) and other important metrics. This helps stakeholders make informed decisions based on real-time data.
2. Financial Reporting
Highcharts is ideal for financial applications, allowing users to create stock charts that visualize market trends, compare multiple financial instruments, and analyze historical data over time.
3. Data Analysis
Researchers and data analysts can leverage Highcharts to visualize complex datasets, making it easier to identify trends, correlations, and outliers in the data.
4. Web Applications
Developers can integrate Highcharts into web applications to enhance user experience by providing dynamic data visualizations. This is particularly useful for applications that require real-time data updates.
5. Educational Purposes
Highcharts can be used in educational settings to create engaging visualizations that help students understand complex concepts. Teachers can create interactive charts to illustrate data-driven topics effectively.
6. Marketing Analytics
Marketing teams can utilize Highcharts to visualize campaign performance, customer engagement metrics, and other relevant data. This allows for better tracking of marketing efforts and ROI analysis.
7. Health Data Visualization
In the healthcare sector, Highcharts can be used to visualize patient data, treatment outcomes, and other health-related statistics, aiding in research and decision-making.
Pricing
Highcharts operates under a freemium model, offering a free version for crafting and design purposes. However, a commercial license is required for publishing charts, which ensures that users can legally share their visualizations. Pricing for the commercial license varies based on the specific needs of the user, such as the scale of usage and the type of organization (e.g., non-profit, educational, or corporate).
Potential users should consider their requirements and budget when evaluating whether to opt for the free version or invest in a commercial license. The benefits of the commercial license include access to premium features, ongoing support, and the ability to publish charts without restrictions.
Comparison with Other Tools
When comparing Highcharts with other charting libraries and tools, several unique selling points set it apart:
1. User-Friendly Interface
Highcharts is known for its intuitive interface, making it accessible to users with varying levels of technical expertise. This contrasts with some other tools that may require more extensive coding knowledge.
2. Extensive Chart Types
While many charting libraries offer a limited selection of chart types, Highcharts provides an extensive range, allowing users to choose the most appropriate visualization for their data.
3. Interactivity and Customization
Highcharts excels in providing interactive charts with robust customization options. Users can easily modify charts to suit their branding and presentation needs, which may not be as seamless in other tools.
4. Active Community and Support
Highcharts has a vibrant community and comprehensive documentation, which can be a significant advantage for users seeking assistance or looking to learn more about the tool.
5. API Integration
Highcharts offers API access, allowing developers to integrate the tool into their applications seamlessly. This level of integration is often more complex with other charting libraries.
6. Accessibility Features
Highcharts places a strong emphasis on accessibility, ensuring that charts are usable by individuals with disabilities. This commitment to inclusivity is a notable advantage over some competing tools.
FAQ
Q1: Is Highcharts free to use?
A1: Highcharts offers a free version for crafting and design purposes. However, a commercial license is required for publishing charts.
Q2: Can I create charts in different languages?
A2: Yes, Highcharts supports multiple languages, allowing users to create charts in their preferred language.
Q3: Does Highcharts provide API access?
A3: Yes, Highcharts offers API access for developers looking to integrate the tool into their applications.
Q4: What types of charts can I create with Highcharts?
A4: Highcharts supports a wide range of chart types, including line, bar, pie, column, area, scatter, heatmaps, and stock charts, among others.
Q5: Are there any accessibility features in Highcharts?
A5: Yes, Highcharts includes accessibility features such as keyboard navigation and screen reader support, making it usable by individuals with disabilities.
Q6: How can I get support for Highcharts?
A6: Highcharts provides extensive documentation and demo pages. Additionally, users can reach out to the support team for assistance with any questions or issues.
In conclusion, Highcharts is a versatile and user-friendly charting library that empowers users to create stunning visualizations with ease. Its robust features, extensive customization options, and commitment to accessibility make it a compelling choice for anyone looking to present data effectively. Whether for business, education, or research, Highcharts offers the tools necessary to transform raw data into meaningful insights.
Ready to try it out?
Go to Highcharts