
Graphy HQ
Graphy HQ simplifies data visualization, enabling anyone to create stunning graphs effortlessly for impactful storytelling and faster decision-making.
 Tags
Tags
 Useful for
- 1.What is Graphy HQ?
- 2.Features
- 2.1.1. AI-Powered Graph Creation
- 2.2.2. User-Friendly Interface
- 2.3.3. Speed and Efficiency
- 2.4.4. Customization Options
- 2.5.5. Interactive Graphs
- 2.6.6. Visual Storytelling
- 2.7.7. Collaboration Features
- 2.8.8. Multiple Data Source Integration
- 2.9.9. Light/Dark Mode
- 2.10.10. API Access
- 3.Use Cases
- 3.1.1. Business Reporting
- 3.2.2. Marketing Analytics
- 3.3.3. Educational Purposes
- 3.4.4. Financial Analysis
- 3.5.5. Project Management
- 3.6.6. Data-Driven Presentations
- 4.Pricing
- 5.Comparison with Other Tools
- 5.1.1. Ease of Use
- 5.2.2. Speed
- 5.3.3. AI Integration
- 5.4.4. Interactive Features
- 5.5.5. Visual Storytelling
- 6.FAQ
- 6.1.1. Is Graphy HQ free to use?
- 6.2.2. What types of graphs can I create with Graphy?
- 6.3.3. Can I collaborate with my team using Graphy?
- 6.4.4. How does the AI feature work?
- 6.5.5. Is there a learning curve associated with Graphy?
- 6.6.6. Can I integrate data from multiple sources?
- 6.7.7. Does Graphy offer API access?
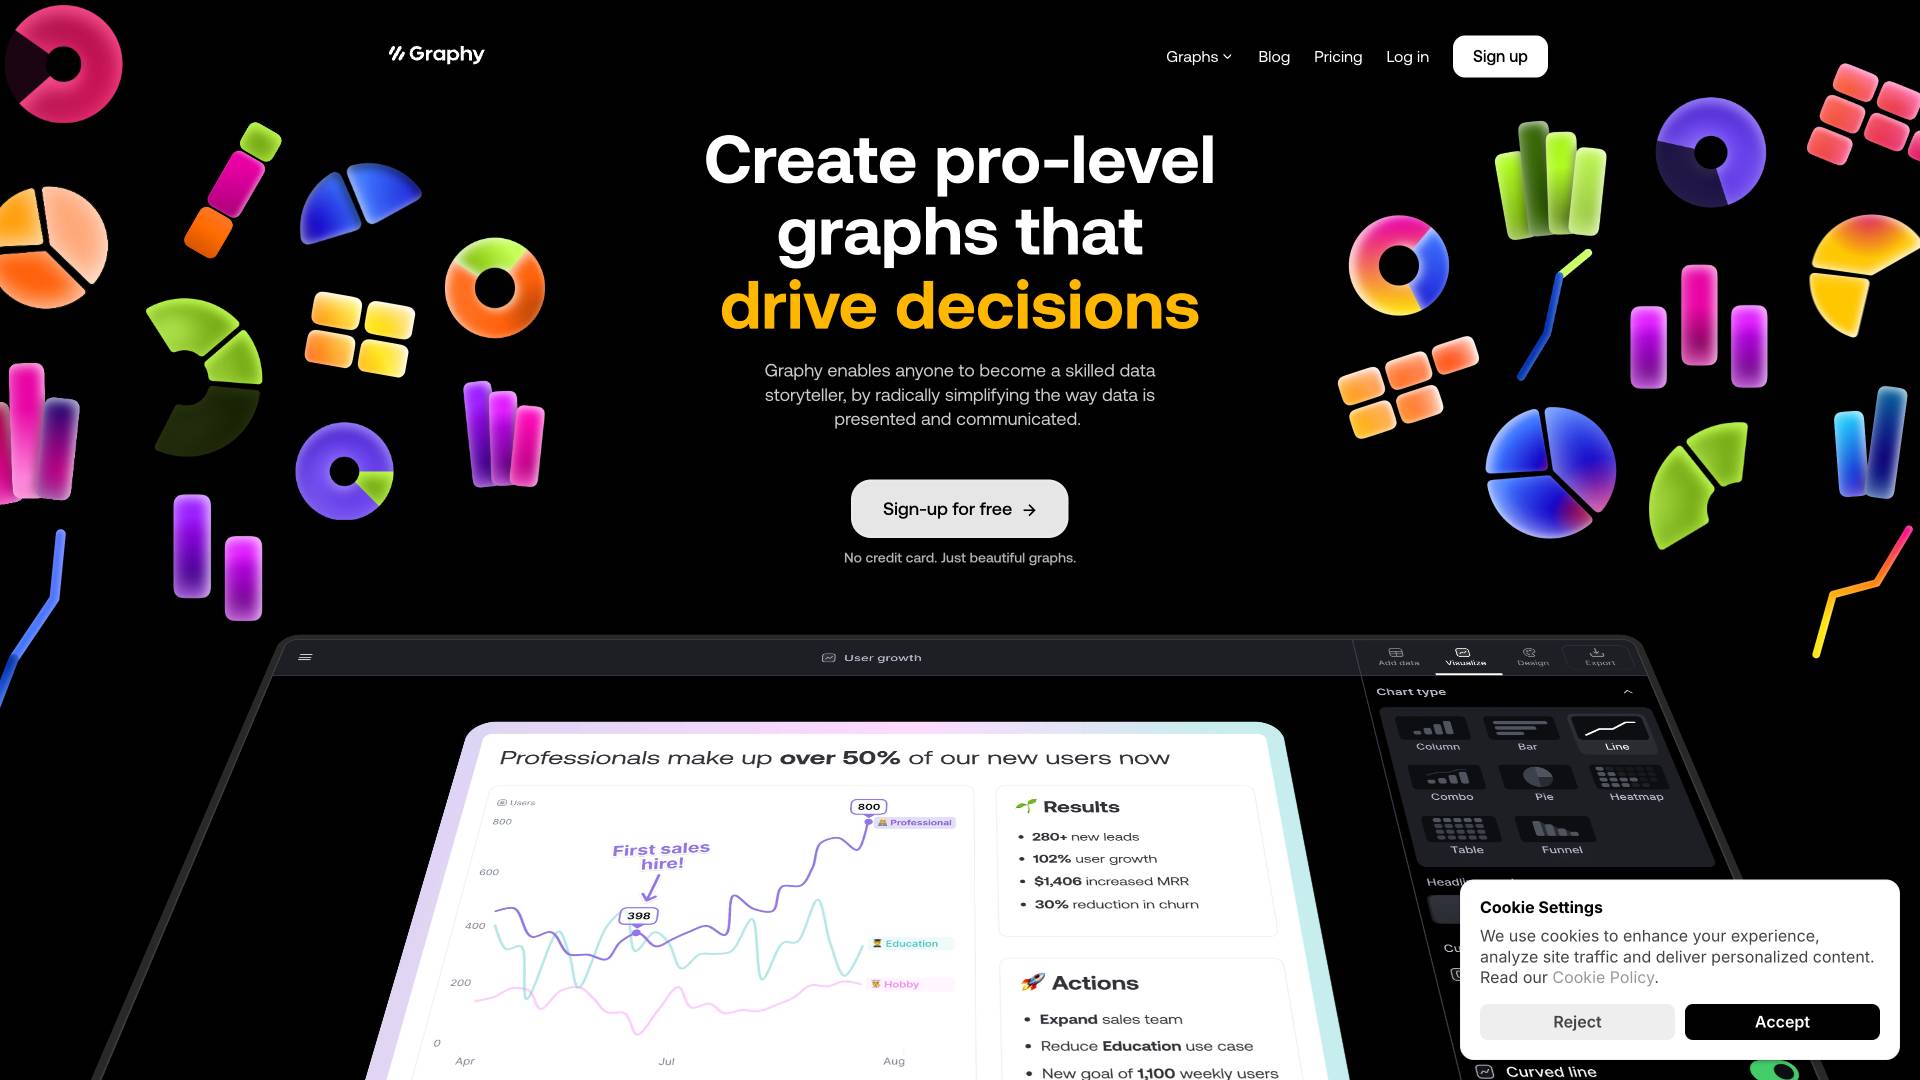
What is Graphy HQ?
Graphy HQ is an innovative data visualization tool designed to empower users to create professional-grade graphs and charts effortlessly. By simplifying the process of data presentation, Graphy enables individuals and teams to become skilled data storytellers. The platform is tailored for modern teams, allowing users to drive decisions, inspire actions, and impress their audience with beautiful and actionable insights derived from their data. With a focus on usability and efficiency, Graphy has garnered trust from over 100,000 users, including data-driven teams across various industries.
Features
Graphy HQ offers a robust set of features that enhance the data visualization experience. Here are some of the key features:
1. AI-Powered Graph Creation
Graphy's AI technology allows users to input their data and automatically generates insightful graphs along with explanations of key insights. This feature significantly reduces the time and effort required to create visualizations.
2. User-Friendly Interface
The platform boasts a simple and intuitive interface that eliminates the learning curve typically associated with data visualization tools. Users can quickly navigate through the features and create stunning graphs without extensive training.
3. Speed and Efficiency
Graphy is designed to be lightning fast, reportedly 80% faster than other data visualization tools. This speed allows users to generate graphs and insights rapidly, promoting quicker decision-making processes.
4. Customization Options
Users can create highly customized charts that suit their specific needs. The platform offers various graph types, including:
- Double bar graphs
- Stacked bar graphs
- Pie charts (with percentages)
- Heatmaps
- Line graphs (with multiple lines)
- Funnel graphs
5. Interactive Graphs
Graphy enables the creation of interactive graphs that can be embedded in various platforms, allowing for seamless sharing and collaboration. This interactivity enhances engagement and understanding among stakeholders.
6. Visual Storytelling
The tool emphasizes making data meaningful through rich storytelling. Users can add visual annotations, goals, and trend lines to their graphs, focusing attention on key data points and enhancing the overall narrative.
7. Collaboration Features
Graphy is built for modern teamwork, allowing users to collaborate within the platform or share graphs through interactive links, images, or embeds in tools like Slack, Notion, Google Slides, and more.
8. Multiple Data Source Integration
The platform allows users to connect data from various sources, making it easier to visualize and analyze data from disparate systems in one place.
9. Light/Dark Mode
Graphy offers a light and dark mode feature, catering to user preferences and enhancing the visual experience based on the environment.
10. API Access
For advanced users, Graphy provides API access, allowing for further customization and integration with other software tools.
Use Cases
Graphy HQ can be utilized across various industries and scenarios. Here are some common use cases:
1. Business Reporting
Businesses can use Graphy to create visually appealing reports that communicate performance metrics, sales figures, and other critical data points to stakeholders. The tool's ability to generate actionable insights helps teams make informed decisions.
2. Marketing Analytics
Marketing teams can leverage Graphy to visualize campaign performance, track engagement metrics, and present data in a compelling way. This allows for better communication of results and strategies to clients and internal teams.
3. Educational Purposes
Educators can use Graphy to create engaging visual aids for lessons, making complex data more accessible and understandable for students. The storytelling aspect of the tool can enhance learning experiences.
4. Financial Analysis
Finance professionals can utilize Graphy to present financial data, forecasts, and analyses clearly and effectively. The customizable charts enable the communication of intricate financial concepts with ease.
5. Project Management
Project managers can visualize project timelines, resource allocations, and progress metrics using Graphy. This helps keep teams aligned and informed about project status and milestones.
6. Data-Driven Presentations
Graphy is ideal for creating presentations that require data-driven insights. Users can generate graphs that seamlessly integrate into slideshows, enhancing the overall narrative and impact of the presentation.
Pricing
Graphy HQ offers a free sign-up option that allows users to explore the platform's features without the need for a credit card. The tool is designed to provide value to individuals and teams, making it accessible to a wide range of users. While specific pricing tiers are not detailed in the content provided, Graphy likely offers additional features or premium options for organizations that require advanced functionalities or higher usage limits.
Comparison with Other Tools
When comparing Graphy HQ with other data visualization tools, several unique selling points stand out:
1. Ease of Use
Graphy is designed with a user-friendly interface that requires minimal training. Many competing tools often have steep learning curves, making Graphy a more appealing option for users who prioritize simplicity.
2. Speed
Graphy claims to be 80% faster than other data visualization tools, allowing users to generate insights and graphs rapidly. This speed can significantly enhance productivity, especially in fast-paced work environments.
3. AI Integration
The AI-powered graph creation feature sets Graphy apart from many traditional tools. While some competitors may offer templates or predefined graphs, Graphy's AI generates custom insights tailored to the user's data.
4. Interactive Features
Graphy's focus on interactivity and collaboration makes it a strong contender in environments where teamwork and real-time sharing are essential. Other tools may lack these features, leading to less effective communication.
5. Visual Storytelling
Graphy emphasizes the importance of storytelling in data presentation, providing users with tools to add context and narrative elements. This focus on storytelling may not be as pronounced in other data visualization platforms.
FAQ
1. Is Graphy HQ free to use?
Yes, Graphy offers a free sign-up option that allows users to explore its features without needing a credit card.
2. What types of graphs can I create with Graphy?
Graphy allows users to create various types of graphs, including bar graphs, pie charts, heatmaps, line graphs, and funnel graphs, among others.
3. Can I collaborate with my team using Graphy?
Yes, Graphy is built for collaboration, enabling users to share graphs and insights with their teams through interactive links, embeds, and images.
4. How does the AI feature work?
Graphy's AI analyzes the data you input and automatically generates graphs and key insights, streamlining the data visualization process.
5. Is there a learning curve associated with Graphy?
No, Graphy is designed to be intuitive and user-friendly, minimizing the learning curve typically associated with data visualization tools.
6. Can I integrate data from multiple sources?
Yes, Graphy allows you to connect and visualize data from various sources, making it easier to analyze and present comprehensive insights.
7. Does Graphy offer API access?
Yes, Graphy provides API access for users who want to customize and integrate the tool with other software solutions.
In conclusion, Graphy HQ is a powerful data visualization tool that stands out for its ease of use, speed, and innovative features. It empowers users to create stunning graphs and actionable insights, making it a valuable asset for teams and individuals looking to communicate data effectively. Whether for business reporting, marketing analytics, or educational purposes, Graphy can transform the way data is presented and understood, driving better decision-making and collaboration.
Ready to try it out?
Go to Graphy HQ