
Google Charts
Google Charts is a free, customizable tool for creating interactive charts and dashboards that display live data on your website.


 Tags
Tags
 Useful for
- 1.What is Google Charts?
- 2.Features
- 2.1.Rich Gallery of Chart Types
- 2.2.Customization
- 2.3.Cross-Browser Compatibility
- 2.4.Dynamic Data Integration
- 2.5.Free to Use
- 2.6.Dashboard Creation
- 3.Use Cases
- 3.1.Business Analytics
- 3.2.Education
- 3.3.Health and Fitness
- 3.4.Web Development
- 4.Pricing
- 5.Comparison with Other Tools
- 5.1.Google Charts vs. Chart.js
- 5.2.Google Charts vs. D3.js
- 5.3.Google Charts vs. Highcharts
- 6.FAQ
- 6.1.1. Is Google Charts free to use?
- 6.2.2. What types of charts can I create with Google Charts?
- 6.3.3. Can I customize the appearance of my charts?
- 6.4.4. Does Google Charts support real-time data?
- 6.5.5. Is Google Charts compatible with all web browsers?
- 6.6.6. Can I create dashboards with Google Charts?
- 6.7.7. What kind of support does Google offer for Google Charts?
What is Google Charts?
Google Charts is a powerful tool that allows users to create interactive charts and data visualizations for their websites. It is a free service provided by Google that leverages HTML5 and SVG technology to deliver visually appealing and informative graphics. The tool is designed to help users present their data in a clear and engaging manner, making it easier for audiences to understand complex information at a glance.
With Google Charts, users can access a rich gallery of chart types, from simple line graphs to intricate hierarchical treemaps, ensuring that there is a suitable option for various data presentation needs. The tool is user-friendly, making it accessible to both novice and experienced developers who want to enhance their websites with dynamic data visualizations.
Features
Google Charts comes packed with a variety of features that make it a popular choice for data visualization. Here are some of the key features:
Rich Gallery of Chart Types
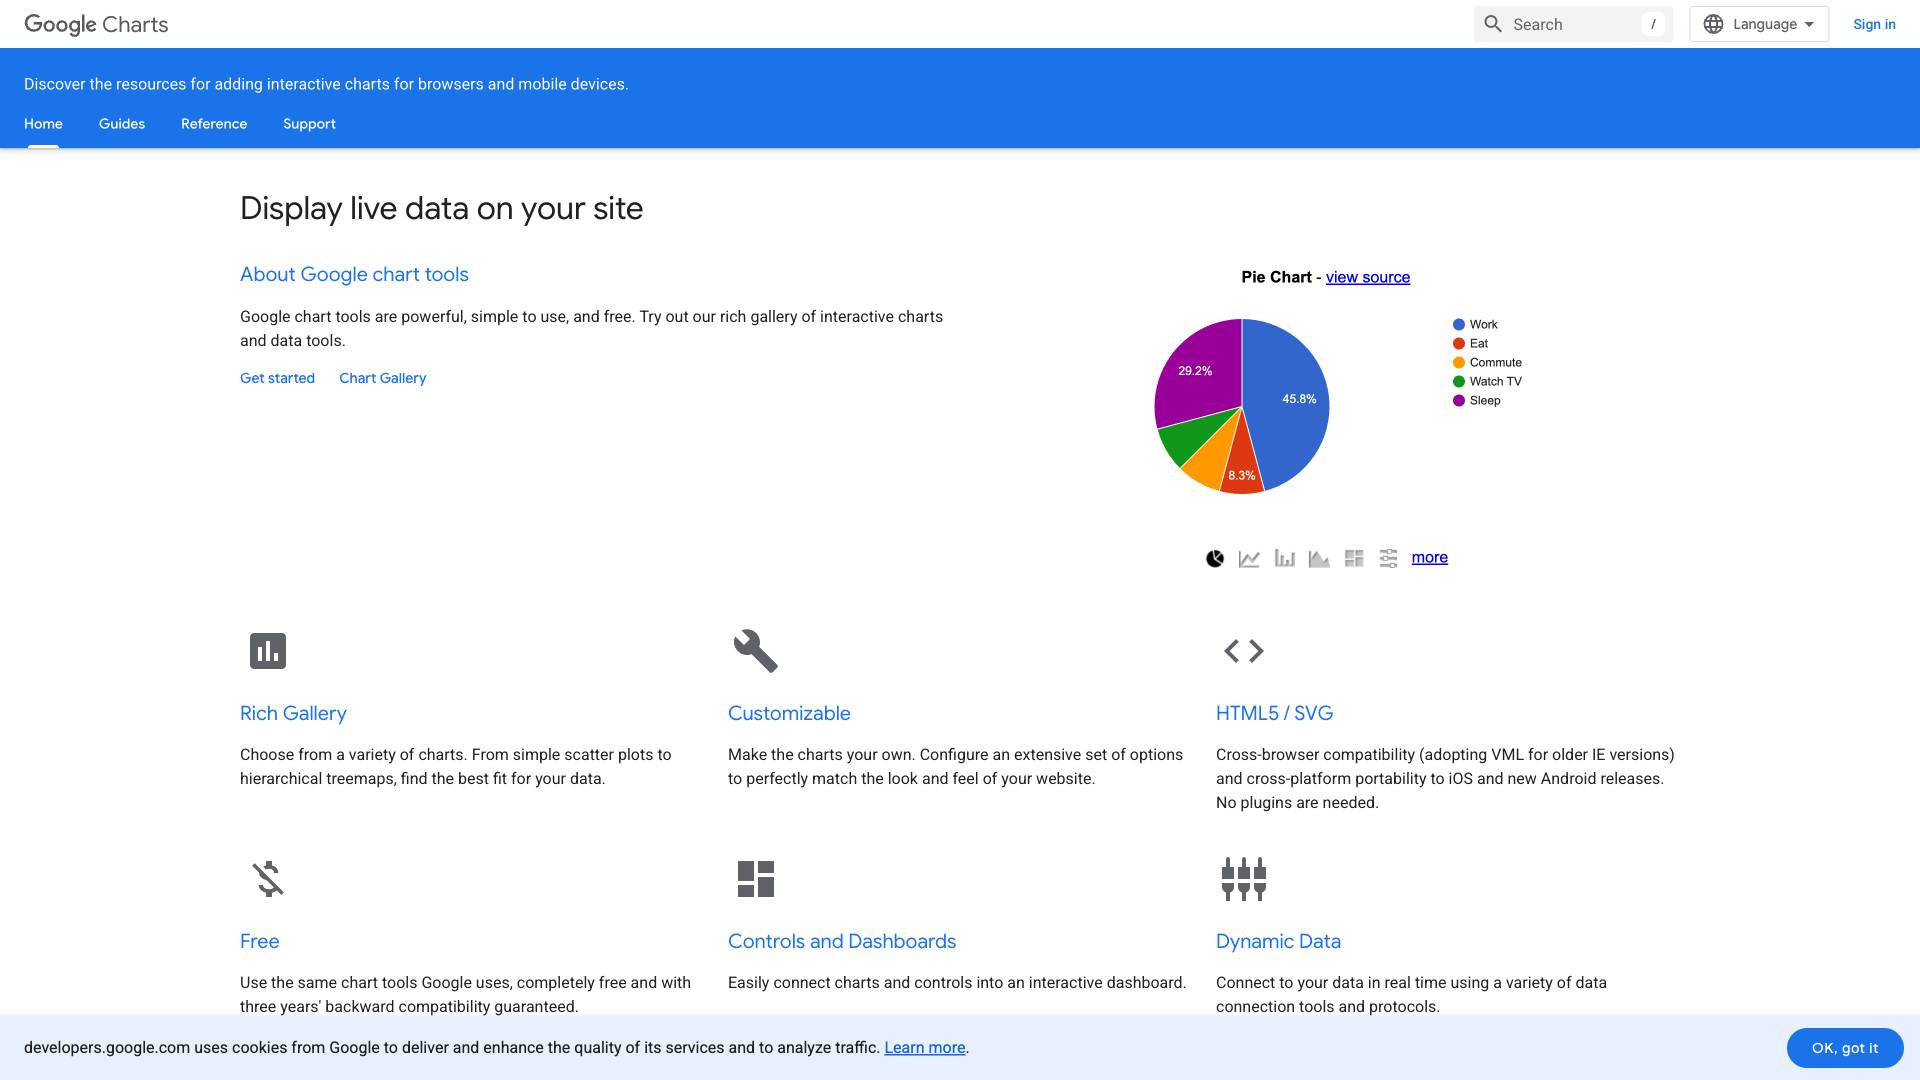
- Diverse Chart Options: Google Charts offers a wide range of chart types, including line charts, bar charts, pie charts, scatter plots, area charts, and treemaps. This variety allows users to choose the best chart type that fits their specific data and presentation needs.
- Interactive Elements: Many charts come with interactive features, such as tooltips and clickable elements, which enhance user engagement and provide additional context to the data being presented.
Customization
- Extensive Configuration Options: Users can customize their charts to match the look and feel of their websites. This includes options for colors, fonts, sizes, and labels, allowing for a personalized touch that aligns with branding.
- Responsive Design: Charts are designed to be responsive, ensuring that they look great on any device, whether it's a desktop, tablet, or smartphone.
Cross-Browser Compatibility
- Support for Multiple Browsers: Google Charts is built using HTML5 and SVG, ensuring compatibility across various web browsers, including Chrome, Firefox, Safari, and Internet Explorer. This broad compatibility allows users to reach a wider audience without worrying about display issues.
- Backward Compatibility: The tool also supports older versions of Internet Explorer by adopting VML (Vector Markup Language), ensuring that users with outdated browsers can still view the charts.
Dynamic Data Integration
- Real-Time Data Connections: Google Charts allows users to connect their charts to live data sources, enabling real-time updates. This feature is particularly useful for applications that require up-to-the-minute data, such as stock market dashboards or live event tracking.
- Multiple Data Connection Protocols: Users can connect to various data sources, making it easy to pull in data from databases, APIs, and spreadsheets.
Free to Use
- No Cost: One of the most appealing aspects of Google Charts is that it is completely free to use. Users can access the same powerful charting tools that Google employs without incurring any costs.
- Backward Compatibility Guarantee: Google promises three years of backward compatibility, ensuring that users can rely on their charts to function correctly even as web standards evolve.
Dashboard Creation
- Interactive Dashboards: Google Charts allows users to create dashboards that combine multiple charts and controls into a single interactive interface. This feature is ideal for presenting comprehensive data insights and facilitating user interaction with the data.
- Controls and Filters: Users can add controls such as sliders, dropdowns, and buttons to their dashboards, enabling viewers to filter and manipulate the data displayed.
Use Cases
Google Charts is versatile and can be applied across various industries and scenarios. Here are some common use cases:
Business Analytics
- Sales Performance Tracking: Companies can use Google Charts to visualize their sales data, track performance over time, and identify trends. This helps in making informed business decisions and strategizing for future growth.
- Market Research: Businesses can present survey results and market research findings through interactive charts, making it easier to communicate insights to stakeholders.
Education
- Data Presentation in Classrooms: Educators can use Google Charts to create visual aids for lessons, helping students grasp complex concepts through visual representation of data.
- Research Projects: Students can utilize Google Charts for their research presentations, showcasing data findings in a professional and engaging manner.
Health and Fitness
- Patient Data Visualization: Healthcare providers can use Google Charts to visualize patient data, track health metrics, and present findings in a clear format to patients and colleagues.
- Fitness Tracking: Fitness apps can employ Google Charts to display users' workout progress, calorie intake, and other health metrics over time.
Web Development
- Enhanced User Experience: Web developers can integrate Google Charts into their applications to provide users with interactive data visualizations, improving the overall user experience.
- Data Dashboards: Developers can create custom dashboards for clients that display key performance indicators (KPIs) and other relevant data in real-time.
Pricing
Google Charts is completely free to use, making it an attractive option for individuals, small businesses, and large enterprises alike. Users can access all features, including the rich gallery of charts and real-time data integration, without any financial investment. This no-cost model allows users to leverage powerful data visualization tools without budget constraints, making it accessible to a wide range of users.
Comparison with Other Tools
When comparing Google Charts with other data visualization tools, several factors come into play. Below is a comparison highlighting the strengths and weaknesses of Google Charts in relation to other popular charting libraries:
Google Charts vs. Chart.js
- Ease of Use: Google Charts is known for its user-friendly interface and straightforward setup, making it accessible for those with limited coding experience. Chart.js, while also user-friendly, may require more coding knowledge for advanced customizations.
- Chart Variety: Google Charts offers a broader selection of chart types, including more complex visualizations like treemaps and gauges, while Chart.js focuses on standard chart types.
- Real-Time Data: Google Charts excels in providing real-time data integration, which may require additional configuration in Chart.js.
Google Charts vs. D3.js
- Customization: D3.js is renowned for its high level of customization and flexibility, allowing developers to create unique visualizations. However, this comes at the cost of a steeper learning curve. Google Charts strikes a balance between customization and ease of use, making it suitable for users who want to create visually appealing charts without extensive coding.
- Performance: D3.js is optimized for performance and can handle large datasets more efficiently than Google Charts. For users working with massive data sets, D3.js may be the preferred option.
- Community Support: D3.js has a larger community and more resources available for developers seeking help, while Google Charts benefits from Google's extensive support and documentation.
Google Charts vs. Highcharts
- Licensing: Google Charts is free to use, while Highcharts requires a license for commercial use. This makes Google Charts a more attractive option for budget-conscious users.
- Interactivity: Both tools offer interactive elements, but Google Charts provides built-in support for real-time data updates, which Highcharts may require additional configuration to achieve.
- Ease of Integration: Google Charts can be easily integrated into various web applications, while Highcharts may require more extensive setup and configuration.
FAQ
1. Is Google Charts free to use?
Yes, Google Charts is completely free to use, making it accessible for individuals and businesses of all sizes.
2. What types of charts can I create with Google Charts?
Google Charts offers a wide variety of chart types, including line charts, bar charts, pie charts, scatter plots, area charts, treemaps, and more.
3. Can I customize the appearance of my charts?
Yes, Google Charts provides extensive customization options, allowing you to configure colors, fonts, sizes, and labels to match your website's design.
4. Does Google Charts support real-time data?
Yes, Google Charts allows you to connect your charts to live data sources, enabling real-time updates for dynamic data visualizations.
5. Is Google Charts compatible with all web browsers?
Google Charts is built using HTML5 and SVG, ensuring compatibility across various modern web browsers, including Chrome, Firefox, Safari, and Internet Explorer.
6. Can I create dashboards with Google Charts?
Yes, Google Charts allows you to create interactive dashboards that combine multiple charts and controls, providing a comprehensive view of your data.
7. What kind of support does Google offer for Google Charts?
Google provides extensive documentation and support for Google Charts, making it easier for users to find help and resources for their charting needs.
In conclusion, Google Charts is a robust and versatile tool for anyone looking to create interactive and visually appealing data visualizations. With its extensive features, ease of use, and cost-effectiveness, it stands out as a go-to solution for developers, businesses, educators, and anyone in need of effective data presentation.
Ready to try it out?
Go to Google Charts