
FusionCharts
FusionCharts is a versatile JavaScript charting library that transforms complex data into beautiful, interactive dashboards with ease for developers.
 Tags
Tags
 Useful for
- 1.What is FusionCharts?
- 2.Features
- 2.1.1. Extensive Chart Library
- 2.2.2. Data Maps
- 2.3.3. Responsive Design
- 2.4.4. Real-Time Data Visualization
- 2.5.5. Time-Series Charts
- 2.6.6. Export Capabilities
- 2.7.7. Integration and Compatibility
- 2.8.8. Customization
- 2.9.9. Comprehensive Documentation
- 2.10.10. Customer Support
- 3.Use Cases
- 3.1.1. Business Intelligence Dashboards
- 3.2.2. Financial Applications
- 3.3.3. IoT Applications
- 3.4.4. Geographic Data Representation
- 3.5.5. Educational Tools
- 3.6.6. Marketing and Sales Reporting
- 3.7.7. Healthcare Analytics
- 4.Pricing
- 4.1.1. Free Trial
- 4.2.2. Licensing Options
- 4.3.3. Additional Costs
- 5.Comparison with Other Tools
- 5.1.1. Ease of Use
- 5.2.2. Comprehensive Documentation
- 5.3.3. Customization Options
- 5.4.4. Performance with Big Data
- 5.5.5. Customer Support
- 6.FAQ
- 6.1.1. What platforms does FusionCharts support?
- 6.2.2. Can I customize the appearance of my charts?
- 6.3.3. Is there a free version of FusionCharts?
- 6.4.4. How can I export my charts or dashboards?
- 6.5.5. What kind of support does FusionCharts offer?
- 6.6.6. Is FusionCharts suitable for real-time data visualization?
What is FusionCharts?
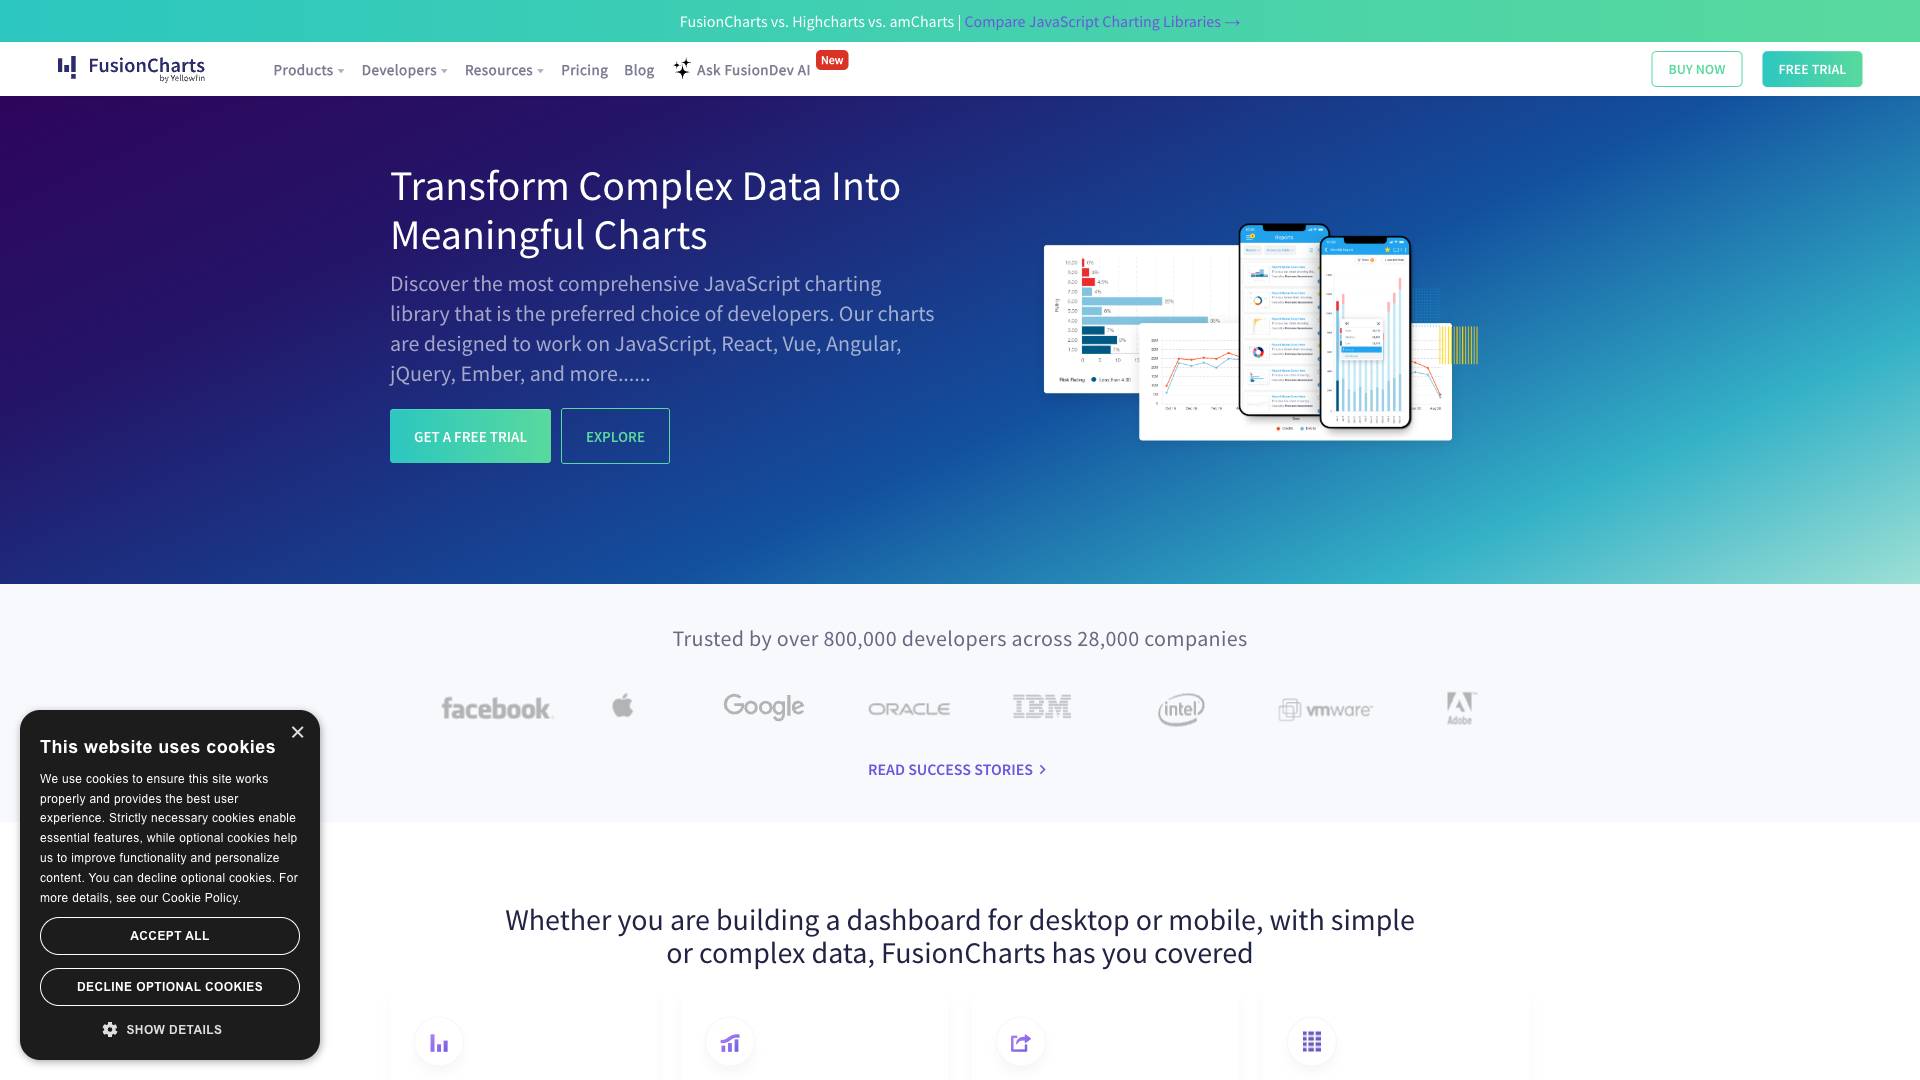
FusionCharts is a powerful JavaScript charting library that enables developers to create interactive and visually appealing charts and dashboards. It is designed to help users transform complex data into meaningful visual representations, making it easier to interpret and analyze information. With support for a wide range of frameworks, including JavaScript, React, Vue, Angular, jQuery, and Ember, FusionCharts is a versatile tool that caters to various development needs.
The library boasts a comprehensive suite of over 100 chart types, including traditional graphs like bar, column, and pie charts, as well as specialized charts such as Gantt, heatmaps, and treemaps. In addition to charts, FusionCharts provides access to more than 2000 choropleth maps, allowing users to visualize geographic data effectively. Trusted by over 800,000 developers across 28,000 companies, FusionCharts is a preferred choice for creating data-driven applications and dashboards.
Features
FusionCharts offers a wide array of features that enhance its usability and effectiveness for developers:
1. Extensive Chart Library
- Variety of Charts: FusionCharts includes over 100 interactive charts and graphs, providing numerous options for data visualization.
- Specialized Charts: In addition to standard charts, users can access domain-specific charts like Gantt charts, spider charts, and waterfall charts.
2. Data Maps
- Choropleth Maps: With over 2000 choropleth maps, FusionCharts allows users to visualize data across various geographical regions, including countries, states, and cities.
3. Responsive Design
- Cross-Platform Compatibility: FusionCharts is designed to work seamlessly on both desktop and mobile devices, ensuring that visualizations are accessible to all users.
4. Real-Time Data Visualization
- Dynamic Updates: The library supports real-time data visualization, making it ideal for applications that require live data feeds, such as stock market trackers and IoT dashboards.
5. Time-Series Charts
- Handling Big Data: FusionCharts provides powerful time-series and stock charts that can render thousands of data points in modern browsers without performance issues.
6. Export Capabilities
- FusionExport: Users can export entire dashboards as PDF files or send live copies via email, enhancing the sharing and presentation of data.
7. Integration and Compatibility
- Framework Support: FusionCharts supports various frameworks, including Angular, React, Vue, jQuery, PHP, and ASP.NET, making it easy to integrate into existing applications.
- Installation Options: The library can be installed via direct JavaScript, CDN, or NPM, providing flexibility in deployment.
8. Customization
- Theming and Configurability: Users can choose from predefined themes or create their own, ensuring a consistent look and feel across charts and dashboards.
9. Comprehensive Documentation
- Developer Resources: FusionCharts offers extensive documentation, tutorials, and live examples to help developers quickly get started and build complex visualizations.
10. Customer Support
- Dedicated Support: FusionCharts provides robust customer support, including a forum and resources for troubleshooting and best practices.
Use Cases
FusionCharts is versatile and can be employed in various scenarios across different industries:
1. Business Intelligence Dashboards
- Data-Driven Decision Making: Companies can use FusionCharts to create dashboards that visualize key performance indicators (KPIs) and other business metrics, enabling informed decision-making.
2. Financial Applications
- Stock Market Visualization: Financial institutions can leverage time-series charts to display stock prices, trends, and historical data, providing users with valuable insights.
3. IoT Applications
- Sensor Data Monitoring: FusionCharts can visualize real-time sensor data from IoT devices, helping businesses monitor performance and detect anomalies.
4. Geographic Data Representation
- Location-Based Analysis: Organizations can use choropleth maps to visualize demographic data, sales performance, or resource distribution across different regions.
5. Educational Tools
- Interactive Learning: Educators can utilize FusionCharts to create engaging visualizations that enhance learning experiences, making complex data more accessible to students.
6. Marketing and Sales Reporting
- Campaign Performance Tracking: Marketing teams can create visual reports to track the performance of campaigns, analyze customer behavior, and identify trends.
7. Healthcare Analytics
- Patient Data Visualization: Healthcare providers can use FusionCharts to visualize patient data, treatment outcomes, and operational metrics, improving overall care quality.
Pricing
FusionCharts offers a variety of pricing plans to cater to different user needs and budgets. The pricing structure typically includes:
1. Free Trial
- Trial Period: Users can access a free trial to test the features and capabilities of FusionCharts before committing to a purchase.
2. Licensing Options
- Single Developer License: Ideal for individual developers or small teams working on personal or commercial projects.
- Team License: Designed for small to medium-sized teams, allowing multiple developers to collaborate on projects.
- Enterprise License: Tailored for large organizations that require extensive support, customization, and additional features.
3. Additional Costs
- Support and Upgrades: Users may incur additional costs for premium support services or upgrades to newer versions of the software.
Comparison with Other Tools
When comparing FusionCharts with other JavaScript charting libraries like Highcharts and amCharts, several unique selling points emerge:
1. Ease of Use
- Quick Setup: FusionCharts boasts a 15-minute setup time for creating the first chart, with a consistent API across different chart types, making it more user-friendly than some open-source alternatives that may require extensive learning.
2. Comprehensive Documentation
- Rich Resources: FusionCharts provides thorough documentation, tutorials, and live examples, which can be more extensive than those offered by other libraries.
3. Customization Options
- Theming Flexibility: The ability to create custom themes and maintain a consistent look across charts sets FusionCharts apart from other libraries that may lack this feature.
4. Performance with Big Data
- Handling Large Datasets: FusionCharts excels in rendering thousands of data points efficiently, making it suitable for applications dealing with big data.
5. Customer Support
- Dedicated Assistance: FusionCharts offers robust customer support, which can be a significant advantage over some open-source libraries that rely on community support.
FAQ
1. What platforms does FusionCharts support?
FusionCharts supports a wide range of platforms, including JavaScript, React, Vue, Angular, jQuery, PHP, and ASP.NET.
2. Can I customize the appearance of my charts?
Yes, FusionCharts allows users to create custom themes and provides various options for chart customization, ensuring a consistent look and feel.
3. Is there a free version of FusionCharts?
FusionCharts offers a free trial that allows users to explore the features and capabilities of the library before making a purchase.
4. How can I export my charts or dashboards?
FusionCharts provides an export feature through FusionExport, allowing users to export entire dashboards as PDFs or send live copies via email.
5. What kind of support does FusionCharts offer?
FusionCharts offers comprehensive documentation, tutorials, and dedicated customer support to assist users with any questions or issues they may encounter.
6. Is FusionCharts suitable for real-time data visualization?
Yes, FusionCharts is designed to handle real-time data visualization, making it ideal for applications that require live data feeds.
In conclusion, FusionCharts stands out as a comprehensive and user-friendly JavaScript charting library, providing developers with the tools needed to create engaging and informative visualizations. Its extensive feature set, versatility, and robust support make it a preferred choice for businesses and developers looking to enhance their data visualization capabilities.
Ready to try it out?
Go to FusionCharts