
Databox
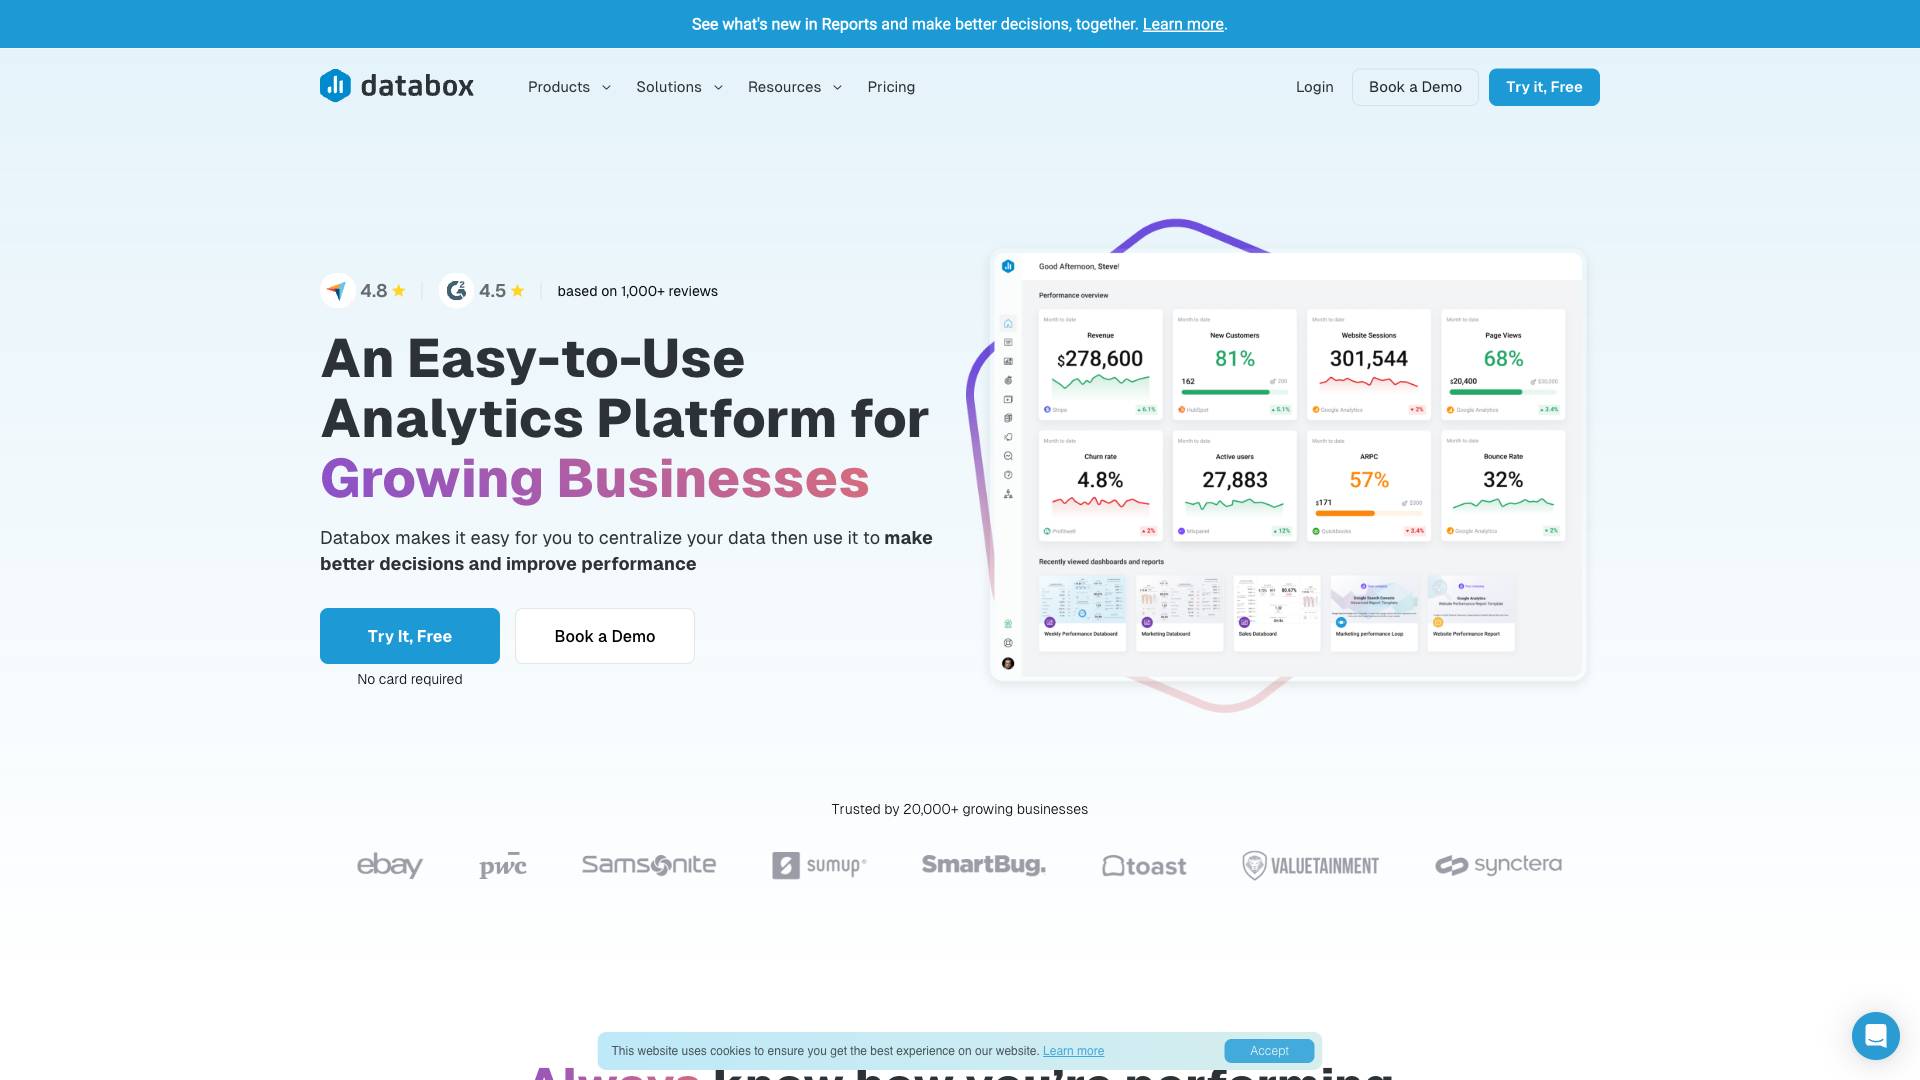
Databox is an easy-to-use analytics platform that centralizes data, enabling growing businesses to make informed decisions and improve performance.


 Tags
Tags
 Useful for
- 1.What is Databox?
- 2.Features
- 2.1.Centralized Data Management
- 2.2.Performance Tracking
- 2.3.Visualization Tools
- 2.4.Reporting Capabilities
- 2.5.Goal Tracking
- 2.6.Forecasting Tools
- 2.7.Benchmarking
- 2.8.User-Friendly Interface
- 2.9.Customer Support
- 3.Use Cases
- 3.1.Marketing Teams
- 3.2.Sales Teams
- 3.3.Executive Leadership
- 3.4.Customer Success Teams
- 4.Pricing
- 5.Comparison with Other Tools
- 5.1.User-Friendly Design
- 5.2.Centralization of Data
- 5.3.Customization and Flexibility
- 5.4.Comprehensive Features
- 5.5.Strong Customer Support
- 6.FAQ
- 6.1.What types of businesses can benefit from Databox?
- 6.2.Is Databox easy to use for non-technical users?
- 6.3.Can I integrate Databox with my existing tools?
- 6.4.Does Databox offer a free trial?
- 6.5.How does Databox support goal tracking?
- 6.6.Can I customize my reports in Databox?
What is Databox?
Databox is a powerful analytics platform designed specifically for growing businesses. It enables organizations to centralize their data from various sources, visualize it in user-friendly dashboards, and make data-informed decisions to enhance performance. With Databox, businesses can streamline their reporting processes, improve insights, and ultimately drive better outcomes through informed decision-making.
Features
Databox offers a robust suite of features that cater to the needs of businesses looking to harness the power of their data. Here are some of the key features:
Centralized Data Management
- Centralized Source of Truth: Databox allows users to consolidate data from multiple sources, including various SaaS applications, databases, APIs, and spreadsheets, into one accessible location.
- Integration with Multiple Tools: Users can connect Databox with hundreds of different tools, making it easy to pull in data from existing systems without the hassle of manual entry.
Performance Tracking
- Metrics & KPIs: Users can track thousands of pre-built metrics and set custom metrics to monitor performance effectively.
- Alerts and Notifications: Databox provides real-time alerts via Slack, Email, or the app when performance changes occur, allowing teams to respond promptly.
Visualization Tools
- Dashboard Creation: The platform features a drag-and-drop builder that enables users to create beautiful dashboards quickly. Users can easily change visuals on the fly and compare multiple timelines.
- Stream Dashboards: Dashboards can be streamed to TVs for team visibility or accessed via a mobile app for on-the-go insights.
Reporting Capabilities
- Custom Reports: Databox allows users to create custom presentations that can be shared automatically. Users can add their branding elements, such as logos and colors, to reports.
- Automated Performance Summaries: The platform combines visuals with automated performance summaries, saving time on manual reporting.
Goal Tracking
- Goal Setting: Users can set specific goals and track their progress within the platform.
- Alerts for Goal Progress: Notifications can be set to inform users if they are not on track to meet their goals, providing an additional layer of accountability.
Forecasting Tools
- Predictive Analytics: Databox allows users to forecast future performance, planning for best and worst-case scenarios.
- Comparison with Historical Data: Users can compare forecasts against historical data and established goals, enabling better strategic planning.
Benchmarking
- Performance Comparison: Users can search through thousands of marketing, sales, and financial benchmarks to identify opportunities for improvement.
- Saving Important Benchmarks: Users can save significant benchmarks to track their performance over time.
User-Friendly Interface
- Ease of Use: Databox is designed to be user-friendly, allowing anyone on the team to build their first dashboard in five minutes or less without needing coding skills or analytical expertise.
- Flexible and Customizable: Each team can tailor the platform to track metrics and goals that are most relevant to their specific needs.
Customer Support
- Personalized Assistance: Databox offers dedicated customer service to help businesses apply the platform to their unique requirements, ensuring a smooth onboarding process.
Use Cases
Databox is versatile and can be utilized across various industries and business functions. Below are some common use cases:
Marketing Teams
- Campaign Performance Tracking: Marketing teams can use Databox to measure the effectiveness of campaigns, track ROI, and make data-driven decisions on future marketing strategies.
- Client Reporting: Agencies can automate client reports, saving time and ensuring that clients receive up-to-date performance insights.
Sales Teams
- Sales Performance Monitoring: Sales teams can track KPIs such as leads generated, conversion rates, and revenue, enabling them to identify areas for improvement and optimize their sales processes.
- Goal Tracking: Sales teams can set targets and monitor their progress in real-time, ensuring accountability and driving performance.
Executive Leadership
- Company Health Overview: Executives can use Databox to get a comprehensive view of the company’s performance, helping them make informed strategic decisions.
- Forecasting Future Performance: Leadership can leverage predictive analytics to anticipate market trends and adjust strategies accordingly.
Customer Success Teams
- Customer Health Monitoring: Customer success teams can track customer engagement and satisfaction metrics, allowing them to proactively address issues and improve customer retention.
- Performance Benchmarking: By comparing performance against industry benchmarks, customer success teams can identify opportunities for improvement.
Pricing
Databox offers a range of pricing plans to accommodate different business sizes and needs. While specific pricing details may vary, the following outlines the general structure:
- Free Trial: Databox provides a free trial option, allowing users to explore the platform's features without any commitment.
- Paid Plans: After the trial, users can choose from various paid plans based on their requirements, including features and the number of users. Pricing typically scales with the size of the organization and the complexity of data needs.
For exact pricing details, potential users are encouraged to visit the Databox website or contact their sales team for personalized quotes.
Comparison with Other Tools
When comparing Databox to other analytics and reporting tools, several unique selling points set it apart:
User-Friendly Design
- Ease of Setup: Unlike many enterprise-level analytics platforms that require extensive training and technical skills, Databox is designed for ease of use, allowing users to create dashboards in minutes.
Centralization of Data
- One-Stop Solution: Many organizations struggle with data scattered across various tools. Databox centralizes data, making it easy to access and analyze without juggling multiple applications.
Customization and Flexibility
- Tailored Solutions: Databox allows teams to customize their dashboards and reports according to their specific needs, providing a flexible solution that adapts to different business requirements.
Comprehensive Features
- All-in-One Platform: Databox combines metrics tracking, visualization, reporting, goal setting, forecasting, and benchmarking in one platform, reducing the need for multiple tools.
Strong Customer Support
- Personalized Assistance: Databox offers dedicated customer support to help users maximize the platform’s capabilities, ensuring that businesses can effectively apply the tool to their unique needs.
FAQ
What types of businesses can benefit from Databox?
Databox is suitable for a wide range of businesses, including B2B, SaaS, B2C, and agencies. It is particularly beneficial for growing businesses that need to centralize their data and improve performance tracking.
Is Databox easy to use for non-technical users?
Yes, Databox is designed to be user-friendly, allowing non-technical users to create dashboards and reports without needing coding skills or extensive training. Most users can build their first dashboard in five minutes or less.
Can I integrate Databox with my existing tools?
Absolutely! Databox supports integration with hundreds of different SaaS applications, databases, APIs, and spreadsheets, making it easy to pull in data from your existing systems.
Does Databox offer a free trial?
Yes, Databox provides a free trial option, allowing potential users to explore the platform's features before committing to a paid plan.
How does Databox support goal tracking?
Databox allows users to set specific goals, track their progress, and receive alerts if they are not on track to meet those goals. This feature helps teams stay accountable and focused on their objectives.
Can I customize my reports in Databox?
Yes, Databox enables users to create custom reports, allowing them to add branding elements like logos and colors. Users can also combine visuals with automated performance summaries for a more comprehensive presentation.
In summary, Databox is a versatile and user-friendly analytics platform that empowers growing businesses to centralize their data, visualize performance, and make informed decisions. With its comprehensive features, ease of use, and strong customer support, Databox stands out as a valuable tool for organizations looking to enhance their data-driven decision-making processes.
Ready to try it out?
Go to Databox