
ChartBrick
ChartBrick lets you easily create, customize, and embed insightful charts from your Notion or Airtable data without coding.
 Tags
Tags
 Useful for
- 1.What is ChartBrick?
- 2.Features
- 2.1.1. Easy and No-Code Friendly
- 2.2.2. Multiple Chart Types
- 2.3.3. Privacy First
- 2.4.4. Real-Time Data Updates
- 2.5.5. Customizable Options
- 2.6.6. Responsive Design
- 2.7.7. Embeddable Charts
- 3.Use Cases
- 3.1.1. Business Analytics
- 3.2.2. Educational Purposes
- 3.3.3. Project Management
- 3.4.4. Marketing Analysis
- 3.5.5. Personal Use
- 4.Pricing
- 5.Comparison with Other Tools
- 5.1.1. No-Code Interface
- 5.2.2. Focus on Privacy
- 5.3.3. Integration with Notion and Airtable
- 5.4.4. Quick Chart Generation
- 5.5.5. Responsive and Customizable Designs
- 6.FAQ
What is ChartBrick?
ChartBrick is a powerful, no-code tool designed to help users create insightful charts from their data stored in popular databases like Notion and Airtable. It simplifies the process of visualizing data, allowing users to generate various types of charts quickly and easily. Whether you're a data analyst, a business owner, or a casual user looking to present data effectively, ChartBrick offers an intuitive interface that enables you to create and embed charts seamlessly.
With a focus on user experience, ChartBrick prioritizes privacy, ensuring that no data is stored on their servers. This makes it an excellent choice for individuals and teams who are concerned about data security. The tool also provides real-time updates, customizable options, and responsive designs, making it suitable for a wide range of applications.
Features
ChartBrick is equipped with a variety of features that enhance its usability and effectiveness. Here’s a breakdown of its key features:
1. Easy and No-Code Friendly
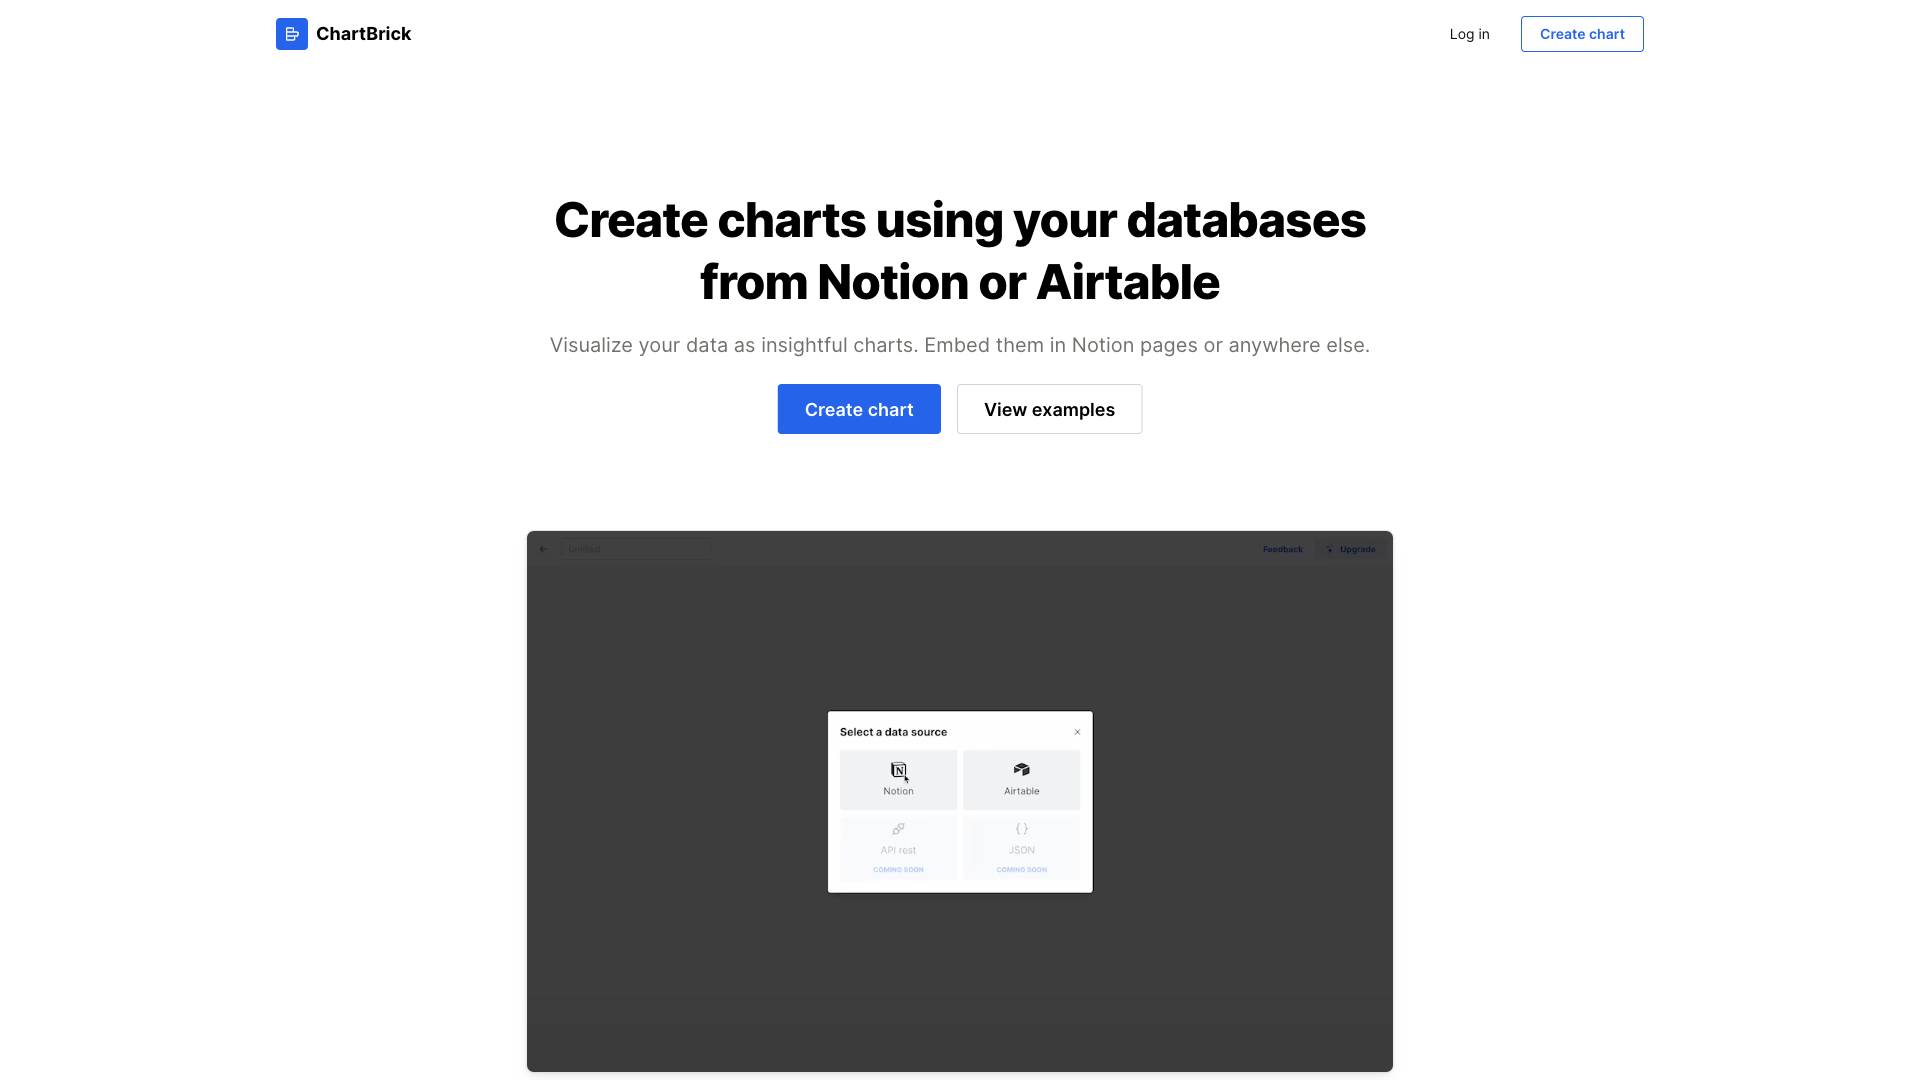
- Simple Integration: Users can effortlessly connect their data sources from Notion or Airtable without any coding knowledge.
- Quick Setup: The entire process of creating a chart can be completed in just a few seconds.
2. Multiple Chart Types
ChartBrick supports eight different types of charts, allowing users to choose the best format for their data:
- Column Charts: Ideal for comparing values across categories.
- Bar Charts: Useful for displaying data in horizontal bars.
- Line Charts: Excellent for showing trends over time.
- Area Charts: Perfect for visualizing cumulative totals over time.
- Pie Charts: Great for showing proportions of a whole.
- Donut Charts: Similar to pie charts but with a hollow center for better readability.
- Radar Charts: Useful for comparing multiple quantitative variables.
- Funnel Charts: Ideal for visualizing stages in a process.
3. Privacy First
- Data Security: ChartBrick does not store any user data, ensuring that your information remains confidential and secure.
4. Real-Time Data Updates
- Dynamic Charts: Charts can be generated with the latest data, allowing users to reflect real-time changes in their visualizations.
5. Customizable Options
- Aggregation, Filtering, and Sorting: Users can manipulate their data to present it in the most relevant way.
- Multiple Themes: Choose from various themes, including dark mode, to enhance the visual appeal of your charts.
6. Responsive Design
- Adaptable Charts: Charts are designed to be responsive, ensuring they look great on any screen size, from desktops to mobile devices.
7. Embeddable Charts
- Versatile Embedding: Users can insert their charts into Notion pages or any other platform, making it easy to share insights across different mediums.
Use Cases
ChartBrick is versatile and can be utilized in various scenarios. Here are some common use cases:
1. Business Analytics
Businesses can leverage ChartBrick to visualize key performance indicators (KPIs), sales data, and customer insights. By creating clear and engaging charts, decision-makers can quickly grasp important information and make informed choices.
2. Educational Purposes
Teachers and educators can use ChartBrick to present statistical data in a visually appealing manner. Whether it’s for classroom presentations or reports, the tool helps in making complex data more understandable for students.
3. Project Management
Project managers can utilize ChartBrick to track project progress, resource allocation, and timelines. By visualizing project data, teams can identify bottlenecks and optimize workflows effectively.
4. Marketing Analysis
Marketers can create charts to analyze campaign performance, customer engagement metrics, and market trends. Visualizing this data helps in assessing the effectiveness of marketing strategies and making necessary adjustments.
5. Personal Use
Individuals can use ChartBrick for personal projects, such as tracking fitness goals, budgeting, or any other data they wish to visualize. The ease of use makes it accessible for anyone looking to present data attractively.
Pricing
ChartBrick offers a straightforward pricing model that caters to different user needs. While specific pricing details were not provided, the tool is designed to be cost-effective, making it accessible for both individuals and businesses. Users can expect a transparent pricing structure that reflects the value of the features offered.
- Free Trial: Many users may benefit from a free trial period, allowing them to explore the tool's features before committing to a subscription.
- Subscription Plans: Various subscription tiers may be available, providing options for casual users and businesses with more extensive data visualization needs.
Comparison with Other Tools
When comparing ChartBrick to other data visualization tools, several unique selling points stand out:
1. No-Code Interface
Unlike many data visualization tools that require coding knowledge or complex setup processes, ChartBrick offers a completely no-code experience. This makes it accessible for users with varying levels of technical expertise.
2. Focus on Privacy
ChartBrick’s commitment to user privacy is a significant advantage. Many competing tools store user data, which can be a concern for individuals and businesses alike. ChartBrick alleviates these concerns by ensuring that no data is retained.
3. Integration with Notion and Airtable
While many data visualization tools can connect to various data sources, ChartBrick specifically integrates seamlessly with Notion and Airtable, two popular platforms for data management. This targeted integration enhances its usability for users already utilizing these tools.
4. Quick Chart Generation
ChartBrick’s ability to generate charts in just a few seconds is a standout feature. Many other tools require more time and effort to create visualizations, making ChartBrick a time-saving option.
5. Responsive and Customizable Designs
ChartBrick’s responsive design ensures that charts look great on any device, which is not always a guarantee with other tools. Additionally, the extensive customization options allow users to tailor their charts to their specific needs and aesthetic preferences.
FAQ
Q: Can I use ChartBrick without any coding experience?
A: Yes! ChartBrick is designed to be user-friendly and no-code, making it accessible for anyone, regardless of their technical background.
Q: What types of charts can I create with ChartBrick?
A: ChartBrick supports eight different chart types, including column, bar, line, area, pie, donut, radar, and funnel charts.
Q: Is my data safe with ChartBrick?
A: Absolutely! ChartBrick prioritizes user privacy and does not store any of your data, ensuring that your information remains confidential.
Q: How quickly can I create a chart?
A: You can create a chart in just a few seconds, thanks to ChartBrick’s intuitive interface and streamlined process.
Q: Can I embed my charts in other platforms?
A: Yes, you can easily embed your charts in Notion pages or any other platform, allowing for versatile sharing of your visualizations.
Q: What kind of support does ChartBrick offer?
A: ChartBrick provides strong customer support to assist users with any questions or issues they may encounter while using the tool.
Q: Is there a free trial available?
A: Yes, users can often explore ChartBrick’s features through a free trial period before deciding on a subscription.
In conclusion, ChartBrick stands out as a powerful, user-friendly tool for creating data visualizations. With its no-code interface, commitment to privacy, and integration with popular platforms, it caters to a wide range of users looking to present their data in an engaging and effective manner. Whether for business analytics, education, or personal projects, ChartBrick offers the features and flexibility needed to turn raw data into compelling visual stories.
Ready to try it out?
Go to ChartBrick