
Chartai
ChartAI is a data visualization tool that allows users to create flowcharts and generate synthetic datasets for enhanced data analysis.
 Tags
Tags
 Useful for
- 1.What is Chartai?
- 2.Features
- 2.1.1. User-Friendly Interface
- 2.2.2. Flowchart Generation
- 2.3.3. Data Import Capabilities
- 2.4.4. Collaboration Tools
- 2.5.5. Educational Resources
- 2.6.6. Settings and Customization
- 3.Use Cases
- 3.1.1. Business Process Mapping
- 3.2.2. Data Analysis and Reporting
- 3.3.3. Educational Purposes
- 3.4.4. Software Development
- 3.5.5. Project Management
- 4.Pricing
- 4.1.1. Free Tier
- 4.2.2. Paid Plans
- 5.Comparison with Other Tools
- 5.1.1. AI-Powered Automation
- 5.2.2. Synthetic Dataset Generation
- 5.3.3. Real-Time Collaboration
- 5.4.4. Comprehensive Educational Resources
- 5.5.5. Customization Options
- 6.FAQ
- 6.1.1. How do I sign up for Chartai?
- 6.2.2. What types of data can I import into Chartai?
- 6.3.3. Can I collaborate with my team in real-time?
- 6.4.4. Is there a mobile version of Chartai?
- 6.5.5. What if I need more than 100 free credits?
- 6.6.6. Are there any tutorials available for beginners?
- 6.7.7. Can I export my flowcharts to different formats?
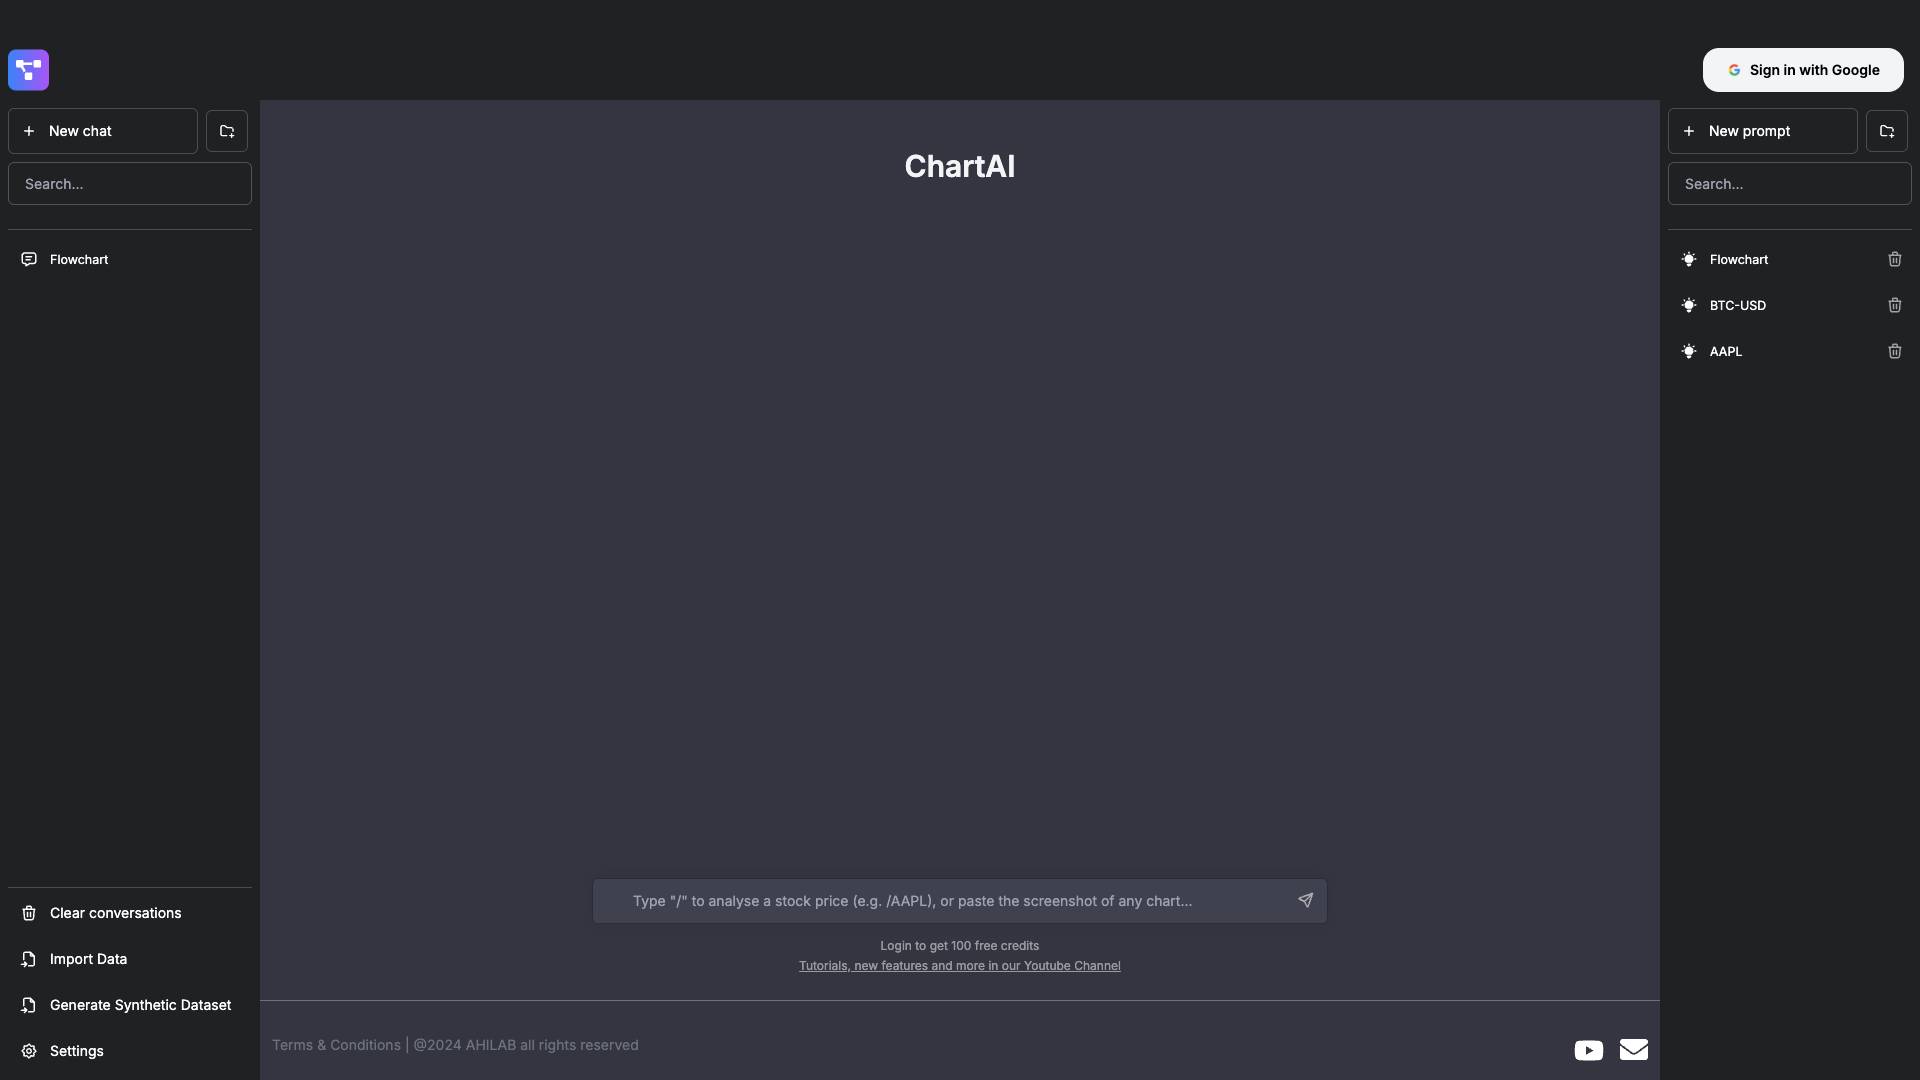
What is Chartai?
Chartai is an innovative data visualization tool designed to streamline the process of creating flowcharts and visual data representations. It leverages artificial intelligence to enhance user experience and offers a range of functionalities that cater to both novice and advanced users. Whether you are a business analyst, a data scientist, or simply someone who needs to present data in a clear and concise manner, Chartai provides the tools necessary to create professional-grade visualizations quickly and efficiently.
Features
Chartai is packed with a variety of features that make it stand out in the crowded market of data visualization tools. Here are some of the key features:
1. User-Friendly Interface
- Intuitive Design: Chartai boasts a clean and straightforward interface that makes it easy for users to navigate through the tool without any prior experience.
- Drag-and-Drop Functionality: Users can easily create flowcharts by dragging elements onto the canvas and connecting them with lines.
2. Flowchart Generation
- Automated Flowchart Creation: Users can input data, and Chartai will automatically generate flowcharts based on the provided information.
- Customizable Templates: The tool offers a variety of pre-designed templates that users can customize to fit their specific needs.
3. Data Import Capabilities
- Multiple Data Sources: Users can import data from various sources, including CSV files, spreadsheets, and databases, making it easy to visualize existing data.
- Synthetic Dataset Generation: Chartai can generate synthetic datasets, allowing users to create mock data for testing and development purposes.
4. Collaboration Tools
- Real-Time Collaboration: Teams can work together in real-time, making it easy to share insights and make adjustments on the fly.
- Commenting and Feedback: Users can leave comments on specific elements of the flowchart, facilitating better communication among team members.
5. Educational Resources
- Tutorials and Guides: Chartai provides a wealth of educational resources, including video tutorials and written guides, to help users maximize the tool's potential.
- YouTube Channel: Users can access a dedicated YouTube channel that showcases new features and provides tips for effective data visualization.
6. Settings and Customization
- Personalized Settings: Users can customize their experience by adjusting settings such as theme, layout, and export options.
- Export Options: Flowcharts can be exported in various formats, including PDF, PNG, and SVG, making it easy to share with others.
Use Cases
Chartai is versatile and can be used in a variety of scenarios across different industries. Here are some common use cases:
1. Business Process Mapping
Organizations can use Chartai to map out business processes, identify bottlenecks, and streamline operations. Flowcharts can help visualize workflows and improve efficiency.
2. Data Analysis and Reporting
Data analysts can create flowcharts to represent complex data relationships and insights. This visual representation aids in communicating findings to stakeholders effectively.
3. Educational Purposes
Teachers and educators can utilize Chartai to create engaging visual aids for their lessons. Flowcharts can help students understand complex concepts and improve retention.
4. Software Development
Developers can use Chartai to outline software architectures, data flows, and user journeys. This visualization can assist in planning and collaboration during the development process.
5. Project Management
Project managers can create flowcharts to outline project timelines, milestones, and task dependencies. This helps in tracking progress and ensuring that projects stay on schedule.
Pricing
Chartai offers a competitive pricing structure that caters to different user needs. Here’s a breakdown of the pricing model:
1. Free Tier
- 100 Free Credits: New users can sign up and receive 100 free credits to explore the tool and its features without any financial commitment.
2. Paid Plans
- Subscription Model: Chartai offers various subscription plans that provide additional credits and access to premium features. Users can choose a plan based on their usage and requirements.
- Enterprise Solutions: For larger organizations, Chartai provides custom pricing and solutions tailored to meet specific needs, including advanced collaboration features and dedicated support.
Comparison with Other Tools
When compared to other data visualization tools in the market, Chartai holds several unique advantages:
1. AI-Powered Automation
- Unlike many traditional tools, Chartai leverages AI to automate flowchart creation, saving users time and effort in designing complex visualizations.
2. Synthetic Dataset Generation
- Chartai's ability to generate synthetic datasets sets it apart from competitors, allowing users to test and develop without needing real data.
3. Real-Time Collaboration
- While many tools offer collaboration features, Chartai’s real-time collaboration capability enhances teamwork and communication, making it easier for teams to work together seamlessly.
4. Comprehensive Educational Resources
- Chartai provides extensive tutorials and a dedicated YouTube channel, ensuring users have access to the resources they need to maximize their use of the tool.
5. Customization Options
- The level of customization available in Chartai allows users to tailor their experience to their preferences, which is often limited in other tools.
FAQ
1. How do I sign up for Chartai?
To sign up for Chartai, simply visit the website and click on the sign-in option. You can sign in using your Google account for a quick and easy registration process.
2. What types of data can I import into Chartai?
Chartai supports various data formats, including CSV files, spreadsheets, and data from databases, allowing for flexible data import options.
3. Can I collaborate with my team in real-time?
Yes, Chartai offers real-time collaboration features, allowing multiple users to work on flowcharts simultaneously and communicate through comments.
4. Is there a mobile version of Chartai?
As of now, Chartai is primarily web-based, but users can access it from mobile devices through a web browser. A dedicated mobile app may be developed in the future.
5. What if I need more than 100 free credits?
If you require more than 100 free credits, you can explore the paid subscription plans that offer additional credits and access to premium features tailored to your needs.
6. Are there any tutorials available for beginners?
Yes, Chartai provides a variety of tutorials and guides, including a dedicated YouTube channel, to help beginners learn how to use the tool effectively.
7. Can I export my flowcharts to different formats?
Absolutely! Chartai allows users to export flowcharts in multiple formats, including PDF, PNG, and SVG, making it easy to share and present your work.
In summary, Chartai is a powerful and user-friendly tool that simplifies the process of creating flowcharts and visual data representations. Its innovative features, diverse use cases, and competitive pricing make it an excellent choice for individuals and organizations looking to enhance their data visualization capabilities. Whether you're a business professional, educator, or developer, Chartai provides the tools you need to effectively communicate complex information through visual means.
Ready to try it out?
Go to Chartai