
Chart Go
ChartGo is a free, user-friendly online tool for creating customizable charts and graphs, making data visualization accessible to everyone.
 Tags
Tags
 Useful for
- 1.What is Chart Go?
- 2.Features
- 2.1.1. Wide Variety of Chart Types
- 2.2.2. Easy-to-Use Interface
- 2.2.1.3. Customization Options
- 2.3.4. Data Import Capabilities
- 2.4.5. Export Features
- 2.5.6. Educational Focus
- 2.6.7. Completely Free
- 3.Use Cases
- 3.1.1. Business Analysis
- 3.2.2. Educational Purposes
- 3.3.3. Personal Projects
- 3.4.4. Research Presentations
- 3.5.5. Marketing Campaigns
- 4.Pricing
- 5.Comparison with Other Tools
- 5.1.1. Cost
- 5.2.2. User-Friendliness
- 6.3. Customization Options
- 6.1.4. Data Import Flexibility
- 6.2.5. Educational Focus
- 7.FAQ
- 7.1.1. Is Chart Go really free to use?
- 7.2.2. What types of charts can I create with Chart Go?
- 7.3.3. Do I need to sign up to use Chart Go?
- 7.4.4. Can I import data from Excel or CSV files?
- 7.5.5. What customization options are available?
- 7.6.6. How can I export my charts?
- 7.7.7. Is Chart Go suitable for educational use?
- 7.8.8. Can I use Chart Go for business presentations?
What is Chart Go?
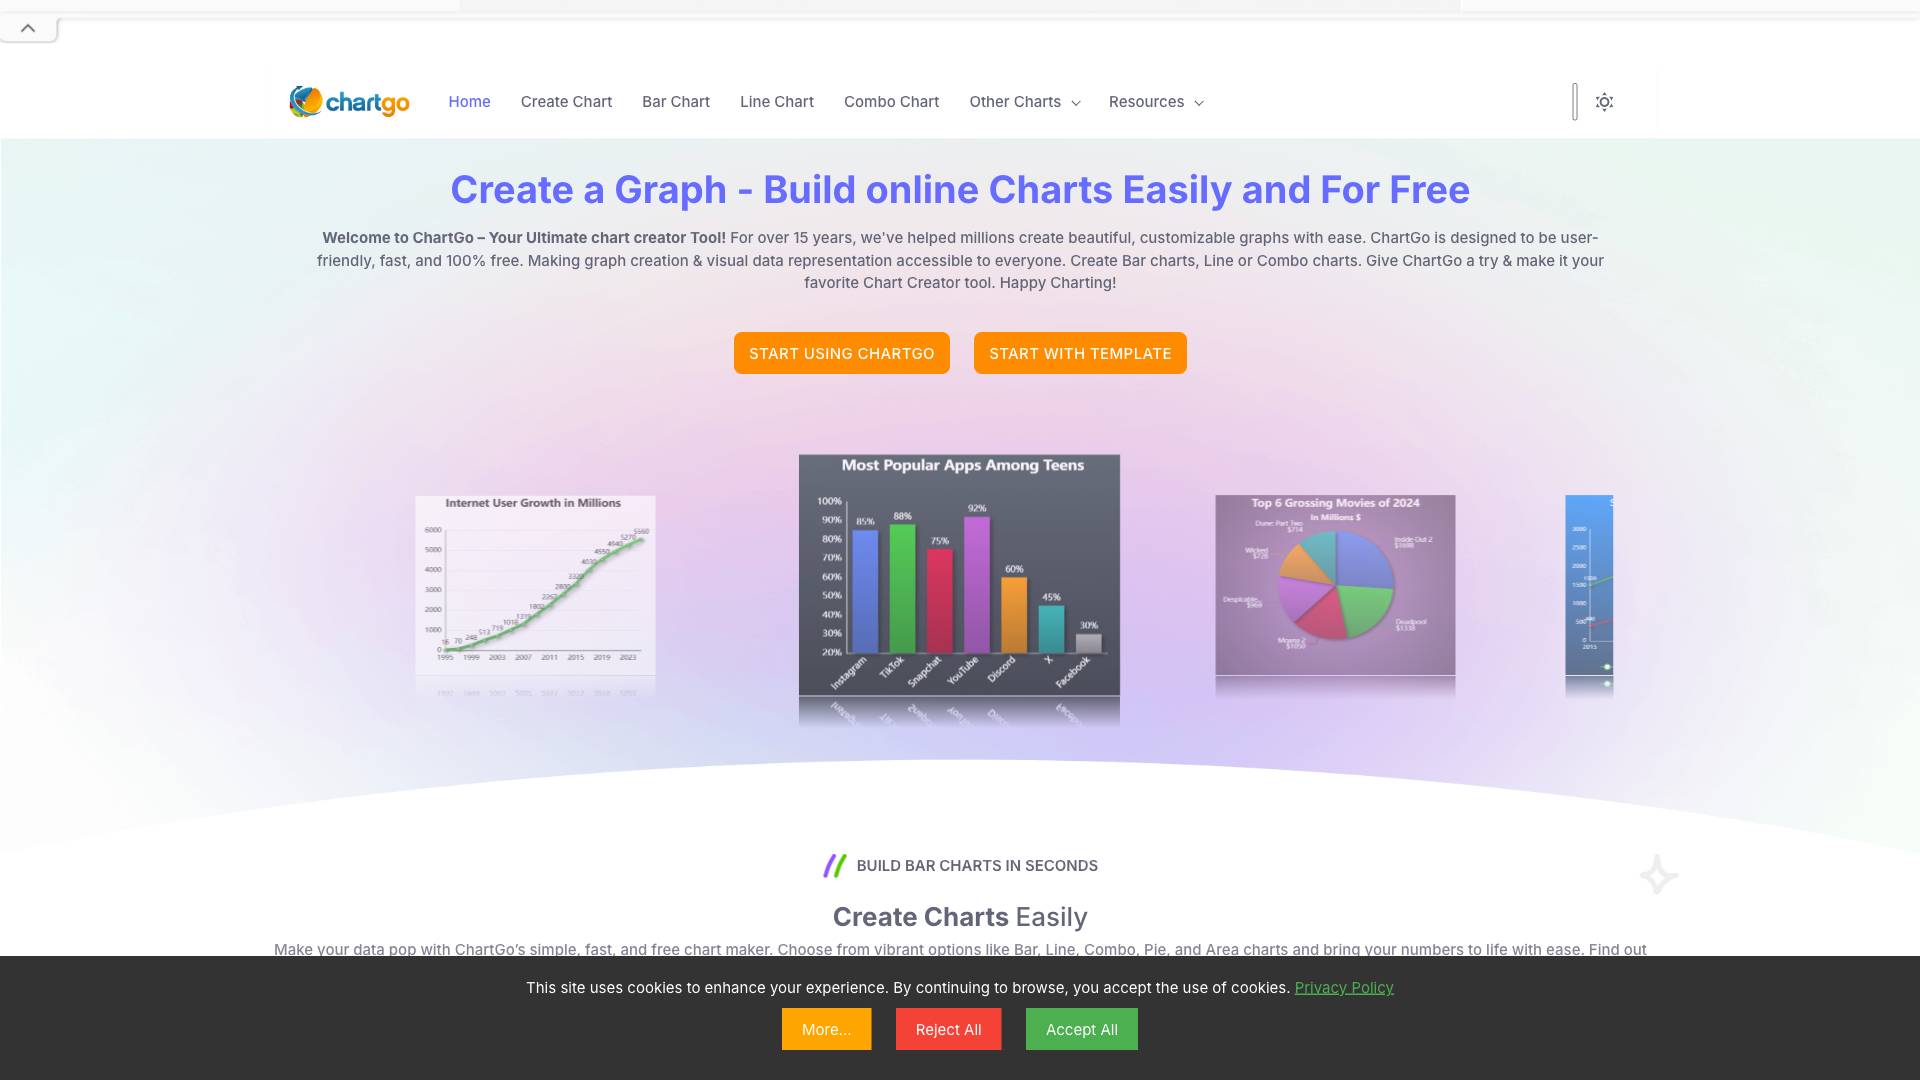
Chart Go is an online chart creation tool designed to simplify the process of building and customizing various types of charts. With over 15 years of experience in the field, Chart Go has become a popular choice for millions of users looking to create visually appealing graphs without the need for extensive technical knowledge. The platform is user-friendly, fast, and entirely free, making it accessible to everyone from beginners to professionals.
The tool supports multiple chart types, including bar charts, line charts, combo charts, pie charts, and area charts, allowing users to effectively visualize their data in a way that is easy to understand. Whether you're looking to present data for educational purposes, business analysis, or personal projects, Chart Go provides a robust solution for all your chart-making needs.
Features
Chart Go boasts an array of features that enhance the user experience and streamline the chart creation process. Below are some of the most notable features:
1. Wide Variety of Chart Types
Chart Go offers a diverse selection of chart types to cater to different data visualization needs. Users can choose from:
- Bar Charts: Ideal for comparing quantities across different categories.
- Line Charts: Perfect for illustrating trends over time.
- Combo Charts: Combine different chart types for a more comprehensive view.
- Pie Charts: Useful for showing proportions and percentages.
- Area Charts: Effective for showcasing cumulative totals over time.
2. Easy-to-Use Interface
The platform is designed with user-friendliness in mind. The intuitive interface allows users to create charts quickly and efficiently, even without prior experience in data visualization. The step-by-step process makes it easy to input data, customize charts, and generate visuals in just a few clicks.
3. Customization Options
Chart Go provides extensive customization options to help users personalize their charts. Users can:
- Adjust colors, sizes, and fonts.
- Add labels, titles, and legends.
- Incorporate interactive elements, animations, tooltips, and trendlines.
These features ensure that each chart can be tailored to fit the user's specific needs and preferences.
4. Data Import Capabilities
Chart Go simplifies the data input process by allowing users to import data seamlessly. Users can:
- Upload Excel or CSV files directly.
- Copy and paste data into the platform.
This flexibility means that users can quickly start creating charts without having to manually enter data.
5. Export Features
Once a chart is created, users can easily share or save their work. Chart Go offers various export options, including:
- High-quality image downloads.
- SVG file formats for scalability.
- CSV data downloads for further analysis.
These options ensure that users can present their charts in a professional manner across different platforms.
6. Educational Focus
Chart Go is widely used by educators and teachers around the world. The vibrant and engaging charts help capture students' attention and make learning more interactive. The platform is an excellent resource for creating educational materials, presentations, and visual aids.
7. Completely Free
One of the standout features of Chart Go is that it is entirely free to use. Unlike many other chart creation tools that require subscriptions or have hidden costs, Chart Go does not impose any fees or sign-up requirements. This makes it an attractive option for individuals and organizations on a budget.
Use Cases
Chart Go can be employed in various scenarios, making it a versatile tool for different users. Here are some common use cases:
1. Business Analysis
Businesses often need to present data in a clear and engaging manner. Chart Go allows professionals to create charts that highlight sales trends, market analyses, and performance metrics. This helps stakeholders make informed decisions based on visual data representations.
2. Educational Purposes
Teachers and educators can utilize Chart Go to create visually appealing charts that enhance learning experiences. By incorporating charts into lessons, educators can help students better understand complex concepts and data relationships.
3. Personal Projects
Individuals working on personal projects, such as budgeting or tracking fitness progress, can benefit from Chart Go’s easy-to-use features. Users can create personalized charts to visualize their data, making it easier to monitor progress and identify trends.
4. Research Presentations
Researchers can use Chart Go to create visual representations of their findings. Whether presenting data at conferences or publishing reports, well-designed charts can significantly enhance the clarity and impact of research presentations.
5. Marketing Campaigns
Marketing professionals can leverage Chart Go to visualize campaign performance metrics, audience demographics, and market trends. Engaging charts can help convey key messages in presentations and reports, making it easier to share insights with teams and clients.
Pricing
Chart Go stands out in the market by offering its services completely free of charge. Unlike many competitors, there are no hidden fees, subscription models, or premium features that require payment. This makes Chart Go an ideal choice for users who are looking for a cost-effective solution for data visualization.
The absence of a pricing model also simplifies the user experience, allowing individuals and organizations to focus on creating charts without worrying about financial commitments. This accessibility is particularly beneficial for students, educators, and small businesses.
Comparison with Other Tools
When comparing Chart Go to other chart creation tools, several key differences emerge:
1. Cost
Many chart-making tools require users to pay for premium features or subscriptions. Chart Go, on the other hand, is entirely free, making it a more accessible option for users who may not have the budget for paid software.
2. User-Friendliness
Chart Go is designed with simplicity in mind, allowing users to create charts quickly and easily. While some other tools may offer advanced features, they can also come with a steeper learning curve. Chart Go's focus on user experience makes it an attractive choice for those who prioritize ease of use.
3. Customization Options
While several chart creation tools provide customization features, Chart Go offers a robust set of options that allow users to personalize their charts extensively. This level of customization ensures that users can create charts that align with their branding or presentation styles.
4. Data Import Flexibility
Chart Go’s ability to import various data formats (Excel, CSV, and copy-paste) makes it more versatile than some competitors that may only support limited input methods. This flexibility enables users to work with their data more efficiently.
5. Educational Focus
Chart Go's emphasis on education and its popularity among teachers set it apart from many other tools that may not specifically cater to the educational sector. The vibrant charts created using Chart Go can enhance engagement and learning outcomes in classroom settings.
FAQ
1. Is Chart Go really free to use?
Yes, Chart Go is completely free to use. There are no hidden fees, subscriptions, or premium features that require payment.
2. What types of charts can I create with Chart Go?
Chart Go supports a variety of chart types, including bar charts, line charts, combo charts, pie charts, and area charts.
3. Do I need to sign up to use Chart Go?
No, there is no sign-up required to use Chart Go. Users can start creating charts immediately without any registration process.
4. Can I import data from Excel or CSV files?
Yes, Chart Go allows users to import data from Excel or CSV files easily. Users can also copy and paste data directly into the platform.
5. What customization options are available?
Chart Go offers a wide range of customization options, including adjustments to colors, sizes, fonts, labels, and the addition of interactive elements like animations and tooltips.
6. How can I export my charts?
Users can export their charts in various formats, including high-quality images, SVG files, and CSV data for further analysis.
7. Is Chart Go suitable for educational use?
Absolutely! Chart Go is widely used by educators and teachers, making it an excellent tool for creating engaging and vibrant charts for educational purposes.
8. Can I use Chart Go for business presentations?
Yes, Chart Go is a suitable tool for creating charts for business presentations, reports, and analyses, helping to visualize data effectively.
In conclusion, Chart Go is a powerful, user-friendly, and completely free chart creation tool that caters to a wide range of users and use cases. With its extensive features and customization options, Chart Go stands out as an ideal solution for anyone looking to visualize data effectively.
Ready to try it out?
Go to Chart Go